|
Core Topics … Social Networks, Network Visualisation & Analysis (NVA), NVA Mapping, Influence Patterns, Communities of
Influence, Advisory Committees, UCINETTM, KNETMAPTM Key Issue … NVA Mapping as a means to
identify influential informal and formal organisational
players such as leaders & innovators; also as a means to visualise the informal communications links and
relationship patters across an organisation. |
CASE 1: Identifying An Organisation’s Most Influential Formal & Informal Leaders & Innovators Via Network Visualisation & Analysis (NVA)Copyright © 2008 The Leadership Alliance Inc.
All rights Reserved A major UK-based Retail Organisation
undertook an NVA project in early 2004 with the primary objectives of
identifying the company’s influential formal and informal leaders and
innovators. The study targeted all members (approximately 100 individuals) of
the three most senior management levels across all the company’s
locations and departments. Internet-based questions were posed to this cross-organisational community, and responses allowed
identification of appropriate influential individuals. As typically happens,
there were many surprises re: individuals identified. The identified managers have since
been organised into advisory committees and action
learning based communities of influence. The formation of these groups has
greatly facilitated successful design and implementation of the organisation’s new leadership development and
innovative practices programmes. The study also
provided invaluable insight into the informal communications links and
relationship patterns across the organisation’s
locations, departments, and management seniority levels; optimisation
activities have been undertaken The notion of
networks as a dominant organising principle is well
established to explain how organisations
“really work”. Subject matter expert networks, leadership
networks, learning and innovation networks, and communities of practice, are
examples of organisational structures that
contribute directly to value creation. Stakeholder relationships are also
important intangible assets that contribute to this value creation. By
developing NVA maps surface these relationships and therefore open them to
better management and optimisation. Unlike the
formal organisation chart, NVA maps can frequently
identify: ·
Bottlenecks
in key business processes; ·
What
would happen to a team if key members left; ·
Sources
of informal influence; ·
Employees
who connect to the far reaches of the organisation; ·
A
good candidate for managing a key department or a new department; ·
Boundary
spanners between contiguous network structures i.e. 'silos of expertise'; ·
Degree
of employee collaboration and interactivity; ·
“High
Potentials”; and ·
Opinion
leaders Analysis of NVA
maps can also influence and help to prioritise
initiatives such as leadership training, succession planning, and replacement
planning, because they provide indicators for monitoring: ·
The
informal leadership of specific groups; ·
Influencers
on products/processes/services; ·
Product/process
experts (‘hubs’ and ‘authorities’); ·
Fragmentation
and ‘structural holes’; and ·
The
‘reach’ of people (their influence) KNETMAPTM
is the Web-based data-gathering tool that builds NVA maps in real time based
on data submitted from organisational members in
response to a question, or series of questions, sent to them via email. It
provides results that are both qualitative and quantitative. Each network map
relates to a given question and depicts a particular dynamic in the organisation by showing who goes to whom for specific
information. The process is typically as follows: ·
A
query is sent by email requesting the respondent to identify sources
(individuals) that relate to the question; ·
Each
person in the target community selects from a list of names that are recognisable as colleagues and co-workers; ·
New
names e.g. external contacts, may be added to the list using a blank form; ·
The
Web-based NVA map is created in real-time after each submission; ·
These
maps can be archived for retrieval at any date, either for decision support,
location of expertise, or to monitor changes in existing networks. KNETMAPTM
can show not only how an individual employee operates within her/his team or
department, but also how teams and departments interact with one another, and
how individuals/teams interact with external stakeholders. This mapping
process is a vast step forward over conventional data gathering that would be
carried out via face-to-face interviews. UCINETTM
is stand-alone analysis software for further analysing
the exported KNETMAPTM data. UCINETTM is particularly
useful for interpreting large maps of over 20 nodes (individuals in a study)
with varying attributes. UCINETTM uses robust social network measures to
evaluate individuals, groups and the whole network. Its metrics include: Node
and Network Centrality, Cluster Analysis, Small-World Networks, Structural
Equivalence, External / Internal Ratio, Reach-In (many steps), Reach-Out
(many steps). The analyses included in this report are based on the Reach
ratios - Reach is one of the most significant metrics for network visualisation, because it reflects not only the number of
incoming links an individual/node has, but most importantly reflects where
those incoming links originate (their importance). Issues
Addressed In This Study The study was
commissioned with the objective of identifying influential individuals from
the company’s three most senior management levels across all locations
and departments) with regard to: ·
Leadership … with a view to forming one or
more a steering groups to facilitate development and introduction of a new
Leadership Development Programme across the
company; ·
Innovation … with a view to forming one or
more groups capable of enhancing innovation across the company, and who would
double as opinion leaders to facilitate introduction and adoption of new
innovations; and to ·
Gain
insight into the organisation-wide network of
communications and relationships related to these themes Approach Two
email-delivered questions that relate to the above objectives were posed to
all members (approximately 100 individuals) of the three most senior
management levels across all the company’s locations and departments.
This community was further amended as responses were collected. The two
questions were: 1.
In
your role as a leader in our company, whom do you seek out for
'brainstorming' around dealing with complex issues in business, interpersonal
or cross-functional situations? Think about people in your area and other
people within the business. 2. Imagine that you are on a project to
develop an innovative approach to creating "a sensational place at Head
Office". Who are the 'ideas' people you want on the project team with
you, from your own or other areas? Prior to
undertaking the KNETMAPTM process and emailing out questions, the
company’s HR Director sent out a note to the target community outlining
the reasoning behind the project and setting out the process. Copies of the
two emails containing the questions were sent to the target community on two
separate days, and a period of two weeks was allowed for all those wishing to
respond to the questions to do so. The final response to the questions was
around 75%. A series of
web-based NVA maps (of people whose expertise was sought) were generated.
After completion of the network visualisation,
analysis, and interpretation, results were reported for further dialog and
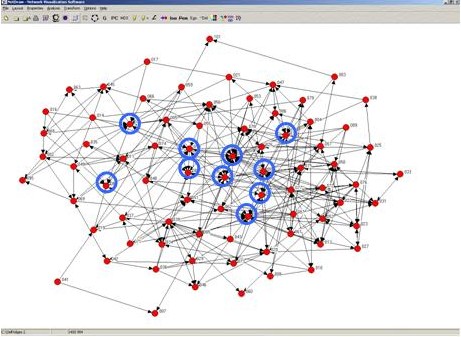
finally for action. Results Figure 1 shows
the NVA map for Question 1. As an example of its use, the “top
ten” people sought out most often by others in a leadership context are
indicated on the map by a blue circle. The NVA provided the names, locations
and management level for a significant
number of such dominant
hubs of high influence. Similar
results were obtained with Questoin 2 relating to
innovation. Connecting these
hubs through action learning
based Communities of
Influence has created (as intended)
powerful and influential steering groups for the development
and support of the new leadership and innovation programmemes
for the company. NVA also provided a
list of names of (a) those who seek out the most influential individuals, and
(b) those who these influential individuals themselves seek out. This has
significantly contributed to understanding the informal communications links
and influence patterns across the various organisational
characteristics included in the study. NVA maps were
also developed to show the density (frequency) of communications between
locations and between departments, leading to some remedial action to repair
shortcomings.
Figure 1 NVA Map For Question #1 (All Nodes not Shown) Conclusions The data gathered in this study met the client’s objectives of identifying its influential formal and informal leaders and innovators. As typically happens, there were many surprises re: individuals identified. The identified managers have since been organised into advisory committees and communities of influence. The formation of these groups has greatly facilitated successful design and implementation of the organisation’s new leadership development and innovative practice programmes. The study also provided invaluable insight into the informal communications links and relationship patterns across the organisation’s locations, departments, and management seniority levels, facilitating remedial activities as necessary. |