|
Core Topics … Social Capital, Network Visualisation & Analysis, Capability Networks,
Knowledge Transfer, Patterns, E-Workplace Systems and Technology, Knowledge Strategy,UCINETTM, KNETMAPTM Key Issue … Network Visualisation & Analysis as a Foundation for
Continuity Planning |
CASE 3: Identifying Subject Matter Experts (SMEs) through Network Visualisation & Analysis (NVA)Copyright © 2008 The Leadership Alliance Inc.
All rights Reserved A Canadian federal department piloted peer-evaluated
expertise identification and continuity planning with 379 of its IT staff. Public service organisations
function mostly on the basis of knowledge. Yet this knowledge is often not
codified and frequently not valued until it begins to ‘leak’
through retirement. If Network Visualisation &
Analysis can identify those individuals deemed by their peers to be subject
matter experts in strategically important products, processes and services,
then it could potentially be a useful decision support tool for continuity
planning. Issues Addressed ·
Identification
of critical skills and expertise (required to deliver the mandate established
by the strategic plan); ·
Mapping
the source of that expertise (a recent reorganisation
of this department disrupted established task networks and access to known
subject matter experts); ·
Recognition
of a need to establish practical knowledge transfer initiatives (by targeting
retirees who are identified by their peers to be key resources in specific knowledge
domains). Objectives ·
Identification
of subject matter experts (i.e. where skills and knowledge reside across a
recently reorganised workplace) in key disciplines; ·
Analyse
the dependence on these people for expert advice, and assess the risk to the organisation if this resource were lost. Approach ·
Peer evaluation of colleagues and
co-workers through eight queries sent by email over a two week
period: Query Example: From whom
do you seek opinions on best practices in risk analysis and conducting a risk
assessment? ·
Each
recipient responded to
the queries by selecting from a pick list of names; ·
New
names (including external contacts) were added to the pick list. Using the data
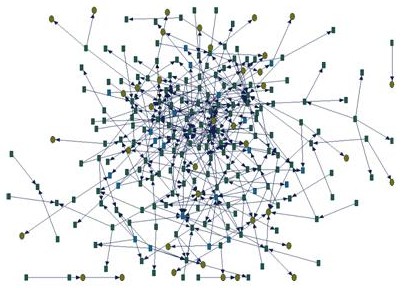
gathering tool KNETMAPTM, data was displayed in real-time in
the form of dynamic Web-based knowledge network maps (see Figure 1).
Figure
1: Sample of an NVA map for Case 3 ___________________________________________________________________ Nodes are color coded by the following
attributes. All names are pseudonyms. n S -- eligible to retire short-term n O -- eligible to retire in
short-term/odd situation n L -- eligible to retire in long-term n N -- not permanent employee n C -- consultant n X -- all others Node
Attribute
Don Topper n X # of incoming links (10); # outgoing links (0) Alan Rockford n S #
of incoming links (15); # outgoing links (0) Rick Laing n S #
of incoming links (12); # outgoing links (0) Cindy Chelsea n X # of incoming links (11); # outgoing links (1) Rand Mercer n X # of incoming links (4); # outgoing links (0) Glen Chester n X # of incoming links (14); # outgoing links (1) Dale Hart n L #
of incoming links (6); # outgoing links (0) Sally Bingam n X # of incoming links (6); # outgoing links (0) Lewis Miller n C # of incoming links (9); # outgoing links (0) Don Belisle n X # of incoming links (5); # outgoing links (0) *Definition of REACH: Reach-In
measures how influential a node is. The metric looks at both direct and
indirect ties. By calculating how many unique nodes seek the
advice/expertise/opinion of node X, the influence of node X can be
determined. The influence of node X goes up if other influential nodes seek
its advice/expertise/opinion. The sphere of influence for node X can be
determined by viewing both direct and indirect in/out links surrounding node
X -- incoming links show who seeks out node X, while outgoing links reveal
who, if anyone, node X seeks for advice/expertise/opinion.
Node
Specific Data
Don Topper: incoming link is
Cindy Chelsea Cindy Chelsea: outgoing link
is Don Topper Glen Chester: outgoing link is
Rand Mercer Figure
2: Analysed Data ___________________________________________________________________ Results·
Lists
of known subject matter experts in the knowledge domains queried ·
Lists
of up-and-coming subject matter experts in the knowledge domains queried ·
Surfacing
of 'surprise' SMEs as key organisational
resources Benefits ·
Reduced
subjectivity in identifying SMEs due to the peer
evaluation approach ·
Identified
individuals with deep corporate knowledge ·
Disclosed emergent communities of practice ·
Exposed strategic vulnerabilities related to
critical skills assets ·
Identified
individuals who are isolated ·
Provided
decision support for targeted training and continuity planning ConclusionThe data gathered in this pilot revealed many of the 'lynchpins'
in the flows of knowledge instrumental to getting things done. Such
individuals are generally only manifest in informal networks because
information flows do not follow managerial lines. These informal links help
circulate information and are responsible for significant activity that
sustains the effective functioning of the organisation. . |