Knowledge Sharing in SMEs: A Comparison of Two
Case Study Organisations
Jonathan Staplehurst, Gillian
Ragsdell, Loughborough University ,UK
ABSTRACT:
The focus of this paper is on the knowledge sharing activities of two small
and medium sized enterprises (SMEs); both companies are based in the
Keywords: Knowledge sharing,
1. Introduction
As more organisations have sought to gain competitive advantage by maximising their knowledge assets, there has been a growing trend in the number of companies implementing a knowledge management (KM) strategy. Although larger companies have dominated the KM literature, there is evidence that more small and medium sized enterprises (SMEs) are adopting KM strategies to attempt to move ahead of their rivals. However, it is recognised that the peculiarities of SMEs mean that they ‘do’ KM differently from large companies (eg McAdam and Reid, 2001; Desouza and Awazu, 2006; Basly, 2007; Supyuenyong et al, 2009) This paper contributes to the developing pool of literature on KM and SMEs by relating the results of a study that explored the knowledge sharing activities in two UK SMEs. Particular attention was paid to: the ways in which the SMEs used their formal and informal knowledge sharing facilities; how organisational roles influence knowledge sharing behaviour; and the knowledge sharing barriers that are faced by the SMEs. While generalisations cannot be drawn from case studies, it is likely that some of the findings and recommendations are pertinent to other organisations.
2. Context Of The Study
In this section the practical and theoretical contexts of the study are
presented. The importance of SMEs to the
2.1. Practical Context
At the start of 2007, there were 4.7 million SMEs in the
So, SMEs are seen as very important to the world economy and sharing knowledge can be considered as critical to their survival. These companies must share knowledge internally, as well as externally, as they aim to improve their viability and, if possible, to grow in these turbulent times.
2.2. Theoretical Context
A brief review of the literature on knowledge sharing sets the scene from a more academic perspective and offers a platform for the subsequent empirical work.
2.2.1. Sharing Knowledge
Internally
In this section, the importance of sharing knowledge within SMEs is highlighted. While the size of SMEs often means that the organisational culture is very conducive for knowledge sharing, the informal nature of knowledge sharing and capture, can bring serious risks.
The importance of sharing knowledge internally is accentuated in SMEs; a characteristic that is well established in the literature. As Barber et al. (1989, pp.9-12) highlighted, SMEs tend to have a high labour turnover and, thus, many regularly lose specialist knowledge that is core to their business. This remains the case today. However, this loss can be minimised if a high level of knowledge sharing takes place within the firm. Knowledge sharing may be supported by training programmes but training may not be able to be placed high on the agenda of SMEs. Barber et al (1989) mentioned that levels of training tend to grow as firms grow and that smaller firms tend to perform training informally. So, small SMEs, in particular, must harness the knowledge of their specialists in order to maintain or create a competitive advantage. If they choose not to, larger firms may head hunt specific individuals or push further ahead through sharing knowledge more effectively.
A little later, Vos et al. (1998) pointed out that SMEs that do not continue to develop their knowledge assets find it hard to survive in competitive markets. They highlight that this can be due not only to SMEs’ slow market reactions but to poor attempts at defining holes within their own knowledge base. From their selected case studies they identify that the role of a consultant is vital to survival; this may not be an option for SMEs.
For SMEs, setting aside a budget to spend on knowledge sharing facilities (or on KM per se) is often not feasible. Indeed, at the ‘small’ end of the SME scale, formal facilities are often not necessary as the regular and close contact between employees means that knowledge generally flows easily via face-to face conversations, and via supporting emails and documents. However, as a small SME expands, knowledge networks may grow beyond the awareness of many employees (Lin and Hsueh, 2006) and the opportunities to share knowledge verbally falls. So, as an SME becomes more successful, its approach to knowledge sharing needs to change; Company A is sensitive to this issue as it continues to expand and to begin the transition out of the SME sector. Adding knowledge sharing facilities, as explored in this study, could ensure the continuation of the growth of organisational knowledge.
2.2.2. Sharing Knowledge
Externally
While there is much to consider in terms of sharing knowledge internally, as is demonstrated in this paper, SMEs cannot ignore the possibility of sharing knowledge externally. There are benefits to be gained from engaging in knowledge sharing with parties external to the organisation; equally there are associated risks from doing so.
As pointed out by Argote et al (2003), publications that focus on external knowledge sharing by SMEs include a review of six emerging themes. One of these themes is the link between an SME’s location and the amount of external knowledge sharing that takes place. For example, they described how external contacts, as well as personal movements between companies, can increase the opportunities for people to learn from each other. However, Argote et al’s (2003) discussion went on to describe how, even though individuals are more likely to share internally with employees from their own organisation, external information is often valued more highly due to employees not knowing all the associated limitations. This is a key point for SMEs who have fewer employees and therefore will need to utilise their external contacts but be prepared to be cautious when acquiring new knowledge. Finally, Argote et al (2003) highlighted the impact of environmental factors and how these affect learning outcomes. For example, one company’s learning can affect another’s. This is especially important for SMEs who could be closely linked to their competition and looking to gain that elusive competitive advantage.
Building on the collection of themes introduced about,
2.2.3. Barriers To Sharing
Knowledge
Knowledge sharing is not always an easy process for organisations to encourage; there are inherent risks (some of which have already been mentioned) and there are barriers. In addition, there may be problems in an organisation’s information and knowledge processes that impact on the quality of its knowledge sharing.
In his seminal paper, Riege (2005) listed a number of these hurdles that companies must overcome to achieve effective knowledge sharing. He categorised them under three headings; organisational, individual and technological barriers. Examples of the barriers included: lack of time, lack of trust, age, gender, poor interpersonal skills, different levels of experience and the physical layout. Rosen et al. (2007) also discussed the barriers to knowledge sharing, albeit in virtual teams. Both authors claimed that if too much time is wasted looking for knowledge that could be easily accessed, companies end up losing their competitive advantage.
However, it is not only the barriers that can prevent effective knowledge sharing, as Boisot (1995, p94-108) demonstrated by listing some of the problems organisations have. Without entering into the information-knowledge debate, the effectiveness of knowledge sharing activities can be hindered by a lack of accuracy in the transmission of know-how. In addition, the transmitted message may not have the desired meaning and the actions that arise from sharing knowledge may not be those originally desired. Further to this, another problem highlighted was the idea that knowledge is diffused as it is passed on.
So, when Riege’s (2005) barriers to knowledge sharing and Boisot’s (1995) problems are combined, it is evident that, while knowledge sharing is perceived to be a process worth pursuing by SMEs, it is not without its difficulties.
3. Research Methods
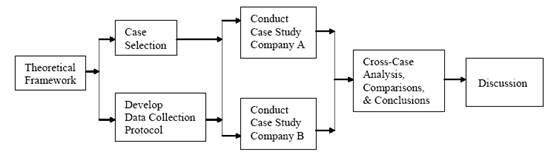
The study followed the work of Leidner et al. (2006, p.22) who put forward a case study approach, shown in Figure 1 below, adapted from the work of Yin (2003). So, two SMEs were selected before evaluating their similarities and differences. Then a series of data collection methods was used that started with observations followed by a questionnaire and interviews.
Figure
1: Case Study Methodology
Characteristics of the selected companies are shown below.
|
Name |
Company A |
Company B |
|
Size |
Medium |
Small |
|
Sector |
Pharmaceuticals |
Engineering |
|
Employees |
~250 |
60 |
Two companies were selected for the study – Company A was positioned at the top end of the SME scale with Company B being positioned at the other. In fact, as the study progressed, Company A’s success was moving it out of the SME sector.
Empirical data collection began with a handful of visits to the companies so as to gain familiarity with protocol and to build up a trusting relationship with potential participants. Once these informal observations were complete, 75% of employees (a figure agreed with management) were invited to complete an online questionnaire. The selection of participants was based on stratified random sampling (Davies 2007, p.60) i.e. an even proportion of each job role was sampled, since the intention was to undertake some analysis of data on the basis of this variable. The questionnaire was based on themes from the literature as discussed above and was structured into four sections; basic information, sharing knowledge, knowledge sharing facilities and barriers to knowledge sharing. In total there were nine questions with seven being closed and the remainder being open. When the results of the questionnaires had been analysed, an interview schedule was designed that was then employed with a selected manager from each company. The interview gave participants the opportunity to develop discussion around topics such as reward schemes, attitudes, office layouts and recent company changes; all of these topics had been identified as of significance from analysis of the questionnaire responses.
Of the 270 employees invited to participate in the survey, just over half took part – this included 124 from Company A and 19 from Company B. Tables 2 and 3, below, summarise the different roles and departments that took part in each company. The differences in company sizes and response rates have been taken account of in discussion of the results.
Table 2: Participating Roles
|
Roles |
A |
B |
|
Director |
1 |
2 |
|
Senior
Management |
10 |
5 |
|
Middle
Management |
46 |
4 |
|
Secretary
/ Administration |
14 |
2 |
|
Student |
10 |
N/A |
|
Other |
15 |
5 |
|
Sales
(Field Based) |
29 |
N/A |
Table 3:
Participating Departments
Departments A B Business
Intelligence 4 N/A CRM 1 N/A Customer
Services 1 1 Finance 4 3 Human
Resources 7 1 IT 3 0 Learning
& Development 3 0 Marketing 22 0 Research
& Development 2 4 Sales
Support (Logistics) 1 1 Sales
(Field Based) 29 n/a Supply
Chain 6 1 Other 41 6
4. Results
The findings from the data collection are now presented and structured in terms of the three aspects under investigation – knowledge sharing facilities, organisational roles and barriers to knowledge sharing.
4.1. Knowledge Sharing
Facilities
The first step in the analysis was to collate how respondents had ranked their company’s knowledge sharing facilities on a four-point scale. By taking the rankings and converting this to a score, statistical analysis enabled the creation of the tables below. With regards to the initial scoring by the participants, the following was allocated per statement (Strongly Agree = 4, Agree = 3, Disagree = 2 and Strongly Disagree = 1), thus mean scores over 2.5 were agreed by the majority. Tables 4 and 5 show rankings by the mean score. However, where two or more factors had the same mean, priority was given to the lowest standard deviation (S.D) figure since the lower S.D indicated that the data was less spread out and therefore the average was more likely to be valid for the majority.
Table 4: Knowledge Sharing Facilities As Ranked By
Company A
|
Company
A |
Mean |
S.D |
Skewness |
Excess Kurtosis |
|
Meeting Rooms |
3.58 |
0.77 |
-2.14 |
4.3 |
|
Desk |
3.22 |
0.90 |
-1.18 |
0.71 |
|
Out of the office – (During work time) |
3.01 |
0.82 |
-0.51 |
-0.29 |
|
Deliberate Knowledge Sharing Facility |
2.89 |
1.02 |
-0.67 |
-0.63 |
|
Canteen |
2.35 |
0.93 |
-0.19 |
-1.03 |
|
Drinks Machine |
2.22 |
0.82 |
-0.22 |
-1.11 |
|
Corridor / Reception |
2.2 |
0.83 |
-0.18 |
-1.12 |
|
Out of the office – (Not during work time) |
2.09 |
0.91 |
0.44 |
-0.64 |
|
Stairs |
1.76 |
0.7 |
0.54 |
-0.19 |
|
Car Park |
1.57 |
0.60 |
0.50 |
-0.63 |
|
Toilet |
1.5 |
0.61 |
0.81 |
-0.31 |
Table 5: Knowledge Sharing Facilities As Ranked By
Company B
|
Company
B |
Mean |
S.D |
Skewness |
Excess Kurtosis |
|
Meeting Rooms |
3.72 |
0.45 |
-1.05 |
-0.9 |
|
Desk |
3.72 |
0.56 |
-2.01 |
2.87 |
|
Out of the office – (During work time) |
2.94 |
0.9 |
-0.97 |
0.47 |
|
Corridor / Reception |
2.56 |
0.68 |
-1.31 |
0.36 |
|
Drinks Machine |
2.5 |
0.69 |
0 |
-0.07 |
|
Out of the office – (Not during work time) |
2.19 |
0.63 |
-0.19 |
-0.46 |
|
Stairs |
1.94 |
0.66 |
0.07 |
-0.55 |
|
Car Park |
1.5 |
0.71 |
1.13 |
-0.07 |
|
Canteen |
1.44 |
0.61 |
1.14 |
0.31 |
|
Toilet |
1.44 |
0.86 |
2.07 |
2.95 |
Overall, the tables show that the majority of respondents within each SME ranked meeting rooms, desks and outside of the office during work time as their key knowledge sharing facilities. However, there are some key differences between the companies’ rankings that probably arise from their differences in size. The positive aspect of Company B being small is that there are more unplanned corridor and drinks machine conservations there due to employees ‘bumping into each other’ more; the downside of being small is the limited provision of knowledge sharing facilities. These differences are evidenced by Company A’s high ranking of the canteen (0.91), whilst the desk (0.5) and the corridor/reception (0.36) are rated higher in Company B. This could be due to less people eating lunch at their desks in Company A and the desk being preferred, at Company B, as there are fewer places to share.
In attempting to develop further understanding of knowledge sharing facilities, respondents were asked which was their favourite to use and why. It can be seen from Table 6 that the most important factors for a knowledge sharing facility were focus, accessible information and privacy. However, some respondents differed by preferring an informal relaxed facility.
Table 6: Favourite Knowledge Sharing Facilities In
Company A
|
Company
A |
Responses |
Main
Reasons |
|
Meeting Rooms |
37 |
Focused Privacy Professional |
|
Desk |
27 |
Information is accessible More appropriate Comfortable |
|
Out of the Office – (During work time) |
18 |
Can find the right environment (hotel, coffee shop etc.) Open and relaxed |
|
Deliberate Knowledge Sharing Facility |
6 |
Comfortable Facilitates communication Informal |
|
Canteen |
5 |
Informal Comfortable People are more relaxed and open |
|
Drinks Machine |
2 |
Informal impromptu chats |
Table 7: Favourite Knowledge Sharing Facilities In
Company B
|
Company
B |
Responses |
Main
Reasons |
|
Meeting Rooms |
9 |
Focused Right people at the right time More perspectives |
|
Desk |
7 |
Information is accessible Better explanations using information |
|
Stairs |
1 |
Only place you can catch someone and you are not
interrupting them |
Overall, it can be seen that there were three main knowledge sharing facilities that both SME firms agreed on. Both firms also showed many similarities in their reasoning behind their use, such as focus, accessible information and privacy. However, the differences were that employees in Company B tended to use their desks more and the canteen less, and relied more on running into people. Company A however, preferred to share knowledge in both formal and informal settings, possibly due to their bigger size and larger amount of field based staff.
Analysis continued so as to find out which job roles within the SMEs share the most work related knowledge. Figures 2 and 3 show how often each job role shares knowledge at each company. From the results it can be seen that directors, senior managers and ‘other’ job roles share knowledge most frequently. However, there was more variation in the secretary/administration and sales job roles. This could be due to sales staff being field based and therefore not coming into the office to share as much as other staff. For the secretary/administration job roles, this might be more varied because their work is more process based then team based.
Figure
2 – Job Roles And Frequency Of Sharing Knowledge In Company A
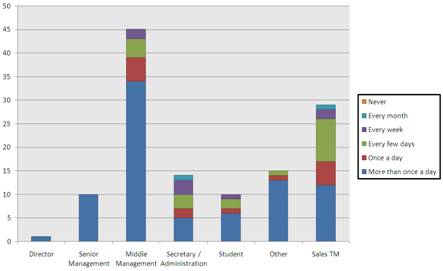
Figure 3: Job
Roles And Frequency
Of Sharing
Knowledge In Company
B
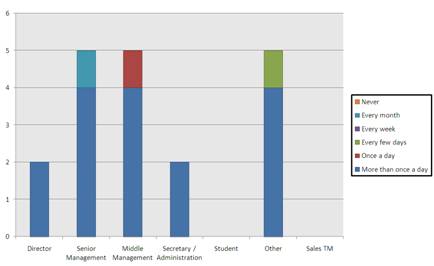
Overall, the majority of responses across Company A opted for more than once a day. Company B also shows a similar pattern but with less variety leading to the possible assumption that they share more; this is followed up in the analysis how long they share knowledge for. It can also be seen that no respondent said they never share knowledge.
In order to evaluate which roles share knowledge for the longest time,
Tables 8 and 9 were created. Means were calculated using a similar method to
that used in section 4.3, by allocating scores to
statements.
Table 8: Average Time Spent Sharing Knowledge In Company A
|
Company
A |
Mean |
0-2 |
3-5 |
6-10 |
11-20 |
21-40 |
41+ |
|
Director |
4.00 |
|
|
|
1 |
|
|
|
Middle Management |
3.89 |
1 |
9 |
9 |
9 |
9 |
8 |
|
Other |
3.73 |
|
5 |
3 |
1 |
3 |
3 |
|
Senior Management |
3.70 |
|
3 |
3 |
1 |
|
3 |
|
|
3.52 |
|
7 |
7 |
9 |
5 |
1 |
|
Secretary / Administration |
2.86 |
2 |
3 |
6 |
1 |
2 |
|
|
Student |
2.50 |
1 |
6 |
2 |
|
|
1 |
Table
9: Average Time Spent Sharing Knowledge
In Company B
|
Company
B |
Mean |
0-2 |
3-5 |
6-10 |
11-20 |
21-40 |
41+ |
|
Other |
3.40 |
|
2 |
|
2 |
1 |
|
|
Senior Management |
3.20 |
|
3 |
|
1 |
|
1 |
|
Secretary / Administration |
2.50 |
|
1 |
1 |
|
|
|
|
Middle Management |
2.20 |
2 |
1 |
1 |
1 |
|
|
|
Director |
2.00 |
|
2 |
|
|
|
|
The tables above show that knowledge is shared for longer periods in Company A (3.54) compared to Company B (2.17). This is also reflected in higher means for Company A in all the different job roles, especially at director and middle management levels. The reasoning behind this could be that the two firms have different organisational cultures that influence the time spent sharing knowledge. However, greater understanding of the reasoning emerges later, when the barriers to knowledge sharing are explored.
To better understand how the respondents share knowledge Tables 10 and 11 show which method different job roles prefer to use when sharing knowledge. It is clear that e-mails and verbal (face to face) methods are the most popular in both companies. A key point from the tables is that only the management in Company B prefer to share using face-to-face methods, suggesting that people on the factory floor prefer emails. The layout of the company may impact on the preferred form of communication since office workers and management are located on a higher floor than the factory workers. Office workers are more likely to come down to see the factory workers with fewer factory workers going upstairs to speak to the office workers.
Table
10: Preferred Method
to Share Knowledge In
Company A
|
Company
A |
Emails |
Reports |
Text Messages |
Verbal (face to face) |
Verbal (phone) |
|
Director |
1 |
|
|
|
|
|
Senior Management |
3 |
1 |
|
6 |
|
|
Middle Management |
23 |
2 |
|
19 |
1 |
|
Secretary / Administration |
5 |
|
|
9 |
|
|
Student |
5 |
|
|
5 |
|
|
Other |
9 |
|
|
5 |
|
|
Sales |
17 |
|
1 |
6 |
5 |
|
TOTAL |
63 |
3 |
1 |
50 |
6 |
Table
11: Preferred Method To Share Knowledge
in Company B
|
Company
B |
Emails |
Reports |
Text Messages |
Verbal (face to face) |
Verbal (phone) |
|
Director |
1 |
|
|
1 |
|
|
Senior Management |
1 |
2 |
|
2 |
|
|
Middle Management |
1 |
|
|
3 |
1 |
|
Secretary / Administration |
2 |
|
|
|
|
|
Other |
4 |
1 |
|
|
|
|
TOTAL |
9 |
3 |
0 |
6 |
1 |
Overall, it can be seen that there is no one specific role that stands out, in either SME, as sharing the most knowledge. The majority of the roles tend to share for long periods and less often or for short periods and more often. However, it could be argued that some roles, for example Company A’s reception and administration staff, and student roles, share less often.
4.3 Barriers
To Knowledge Sharing
Following a similar approach again, a ranked list was created of the barriers to knowledge sharing for each company. The same method of scoring was adopted to help maintain consistency. Tables 12 and 13 show the two companies’ barriers to knowledge sharing ranked by their mean scores.
Table 12:
Ranked List Of Knowledge Sharing Barriers For Company A
|
Company
A |
Mean |
S.D |
Skewness |
Excess Kurtosis |
|
Lack of Time |
2.35 |
0.83 |
0 |
-0.61 |
|
Experience |
2.24 |
0.8 |
-0.17 |
-0.92 |
|
Transparent rewards |
2.19 |
0.78 |
0.19 |
-0.43 |
|
Interpersonal Skills |
2.13 |
0.82 |
0.11 |
-0.82 |
|
Low awareness of value |
2.11 |
0.79 |
0.21 |
-0.58 |
|
Not receiving just recognition |
2.04 |
0.66 |
0.14 |
-0.15 |
|
Physical Layout |
2.03 |
0.8 |
0.34 |
-0.46 |
|
Competitiveness |
2.02 |
0.69 |
0.29 |
0.03 |
|
Initiatives |
2.00 |
0.77 |
0.33 |
-0.44 |
|
Trust |
1.95 |
0.74 |
0.33 |
-0.42 |
|
Only Top-down |
1.88 |
0.61 |
0.08 |
-0.4 |
|
Job Security |
1.84 |
0.66 |
0.35 |
0.01 |
|
Cultural Constraints |
1.83 |
0.64 |
0.17 |
-0.61 |
|
Education |
1.72 |
0.60 |
0.22 |
-0.58 |
|
Age |
1.57 |
0.57 |
0.4 |
-0.75 |
|
Gender |
1.48 |
0.52 |
0.25 |
-1.5 |
Table 13: Ranked List Of Knowledge Sharing Barriers For Company B
|
Company
B |
Mean |
S.D |
Skewness |
Excess Kurtosis |
|
Experience |
2.42 |
0.67 |
0.30 |
0.07 |
|
Lack of Time |
2.37 |
0.58 |
-0.3 |
-0.59 |
|
Education |
2.32 |
0.98 |
0.37 |
-0.73 |
|
Interpersonal Skills |
2.21 |
0.83 |
0.72 |
0.26 |
|
Transparent rewards |
2.11 |
0.64 |
-0.10 |
-0.46 |
|
Low awareness of value |
2.10 |
0.72 |
0.73 |
1.04 |
|
Only Top-down |
2.05 |
0.51 |
0.09 |
0.99 |
|
Initiatives |
2.05 |
0.60 |
-0.03 |
-0.13 |
|
Physical Layout |
2.05 |
0.69 |
0.96 |
1.93 |
|
Cultural Constraints |
2.00 |
0.65 |
0 |
-0.49 |
|
Job Security |
1.95 |
0.83 |
0.10 |
-1.44 |
|
Not receiving just recognition |
1.94 |
0.70 |
0.08 |
-0.87 |
|
Trust |
1.84 |
0.49 |
-0.37 |
0.74 |
|
Age |
1.63 |
0.74 |
1.57 |
3.11 |
|
Competitiveness |
1.58 |
0.49 |
-0.34 |
-1.84 |
|
Gender |
1.47 |
0.5 |
0.11 |
-1.93 |
The table shows that none of the barriers in either company were rated as a barrier by the majority (ie none were above 2.5). Yet, from analysing the top barriers it can be seen that lack of time, experience, interpersonal skills and transparent rewards top both lists. The key difference found was that education was rated 0.6 higher in the Company B list. This may be due to Company B having a wider range of employees. The second key difference was that competitiveness was rated 0.44 higher in the Company A list which may be due to there being more staff, teams and departments or less opportunities for promotion.
In order to understand more about the knowledge sharing barriers, Tables 14 and 15 were compiled. This shows who was saying which barriers were preventing knowledge from being shared. The top three barriers for each job role from each SME are given. This is purely based on the mean scores so, again, any mean scores over 2.5 (highlighted in the table) are those that are seen as a barrier by the majority.
Table
14: Knowledge Sharing Barriers Per Job Role In Company A
|
Company
A |
Barrier
1 |
Mean |
Barrier
2 |
Mean |
Barrier
3 |
Mean |
|
Director |
Lack of
Time |
3.00 |
Value
& Benefit |
3.00 |
Interpersonal Skills |
3.00 |
|
Senior Management |
Lack of
Time |
2.40 |
Transparent Rewards |
2.10 |
Experience Levels |
2.10 |
|
Middle Management |
Lack of
Time |
2.39 |
Lack of
Trust |
2.18 |
Physical
Layout |
2.11 |
|
Secretary / Administration |
Transparent Rewards |
2.64 |
Lack of
Recognition |
2.43 |
Experience Levels |
2.43 |
|
Student |
Experience Levels |
2.90 |
Interpersonal Skills |
2.70 |
Value
& Benefit |
2.50 |
|
Other |
Experience Levels |
2.27 |
Lack of
Recognition |
1.93 |
Lack of
Time |
1.93 |
|
|
Lack of
Time |
2.14 |
Experience Levels |
2 |
Initiatives |
2 |
Table 15: Knowledge Sharing Barriers Per Job Role In
Company B
|
Company
B |
Barrier
1 |
Mean |
Barrier
2 |
Mean |
Barrier
3 |
Mean |
|
Director |
Job
Security |
3.00 |
Lack of
Time |
2.50 |
Value
& Benefit |
2.00 |
|
Senior Management |
Lack of
Time |
2.80 |
Value
& Benefit |
2.40 |
Experience Levels |
2.40 |
|
Middle Management |
Experience Levels |
2.60 |
Education Levels |
2.40 |
Transparent Rewards |
2.40 |
|
Secretary / Administration |
Job
Security |
2.50 |
Experience Levels |
2.40 |
Transparent Rewards |
2.40 |
|
Other |
Interpersonal
Skills |
3.20 |
Education Levels |
3.00 |
Experience Levels |
2.60 |
Tables 14 and 15 show that, although both SMEs agreed on there being no barriers as a majority, there are specific perceived barriers for specific job roles. Within Company A, three job roles highlight five barriers with interpersonal skills coming up twice. The reasoning behind this could be that these roles are kept out of the loop in regards to key decision making information. For example, directors may only see an overview without truly knowing the details. Company B also highlights five issues, but from four roles and with experience levels appearing twice. The barriers highlighted show a difference in experience/education between the management and the other staff at Company B. As well as this, it shows directors were more likely to protect their knowledge whilst senior managers could not find the time to express theirs.
Overall, both companies showed no barriers that were agreed by the majority. However, when broken down by role it was clear to see where the barriers were. For Company A it could be seen that certain roles were finding more problems relating to knowledge sharing then others. This was possibly due to roles being less involved in businesses processes and having access to certain information. Company B showed a split in education/experience between the management and the other roles. However, with the recent move to new premises, the firm might see this decrease in the future as more sharing takes place. To add further insight the results of the follow up interviews were also analysed. The main points of the combined analysis are listed below for each company.
4.4. Summary Of Results
Analysis of the data has surfaced some similarities and some differences between the two SME’s internal knowledge sharing. The similarities include the respondents’ preference of knowledge sharing facilities, of meeting rooms, desks and sharing outside of the office during work time. It could be expected that this would be the case in many SME firms as these are some of the basic facilities in many organisations. The second similarity was the mixture between the time spent sharing and how often they shared knowledge. It could be seen that there was no one role that shared knowledge for long times and more than once a day. This could be due to the roles selected for the questionnaire or the structure of the firms. Finally, the top barriers rated by the companies as a whole were also similar. These were a lack of time, experience and a lack of visible rewards for sharing. Yet, this could be due to the organisation’s field of work, size and valuation of knowledge sharing.
The differences found included Company A’s view of its informal facilities. This probably differed from Company B because Company A had more field based staff and possibly needed more space to share, due to its size. The second difference was in the different job roles that raised barriers to knowledge sharing. Company B showed a split between the management and the other roles in regards to education/experience. This was different from Company A, where it was highlighted that certain roles were experiencing barriers, possibly, due to being left out of the loop.
5. Discussion
This penultimate section develops further understanding of the key points that have been drawn out of the data analysis. Discussion is arranged in terms of the recurring three themes.
5.1. Knowledge Sharing
Facilities
A trend was seen between the two SMEs regarding the most popular facilities. The most popular ones were formal settings inside the office or formal settings, found by field-based staff, outside of the office. However, there were differences when analysing the use of informal facilities, as Company A rated its use higher than Company B. This can also be seen by Company B’s lack of deliberate knowledge sharing facilities and the staff’s reliance on impromptu conversations in the corridors and stairwells. However, Company B does rate its formal knowledge sharing facilities highly, possibly to account for the lack of comfortable informal settings. It can also be taken into account that Company A had more field based staff and this may be the reason behind the informal facilities’ popularity.
Further to this, the results build upon the work of Beijerse (2000), who suggests that SMEs create informal cultures to increase knowledge sharing. At Company A this has been seen by both the employees and the management, who had provided facilities to accommodate the culture, for example the ‘pit stops’. However, at Company B an informal culture could only be seen on the factory floor, as they went to lunch or for smoking breaks in small groups. This was in contrast to half the office staff that were observed eating lunch alone at their desks.
Overall, the results show that SMEs rely heavily on their knowledge sharing facilities; this is perhaps not too surprising given the high levels of investment capital needed for many supporting KM technologies that put them out of reach of small organisations.
5.2. Organisational Roles
The results of this section showed no direct relationship between specific roles sharing more than others. However, Gupta (2008, p.193) found from his study that directors tend to have a low level of trust and score poorly when it comes to knowledge sharing. In regards to this study’s findings, the three directors involved scored reasonably well for knowledge sharing and did not list trust as a barrier. This study also contradicts McAdam & Reid (2001), who highlight that senior managers within SMEs play a different role by capturing the most knowledge as opposed to sharing it. The results show a clear spread of senior managers allocating time for knowledge sharing, with very little indication that they share any more or less than other roles. However, both sets of senior managers did list a lack of time as their biggest barrier to knowledge sharing.
By analysing the roles individually the paper locates some of the possible issues facing SMEs. For example, certain job roles felt that there was a lack of transparent rewards to encourage them to share knowledge or that other employees did not understand the value of knowledge sharing. This understanding was also seen by Vos et al. (1998) as mentioned in Section 2.2.1, who point out how SMEs find it hard to survive due to holes forming in the organisations knowledge base and that they should take on a consultant to survive. This study has shown that, even though there are some problems, SMEs can survive and learn by themselves. Both case study organisations were seeing corporate growth even though specific roles highlighted numerous knowledge sharing barriers.
5.3. Barriers To Knowledge
Sharing
The results show a link between SMEs and certain knowledge sharing barriers. For example, both SMEs rated the same five barriers in the top six of their ranked lists. One of these barriers, was employees’ ability to recognise the value of knowledge and this follows Levy et al. (2003), who suggest that this is a specific weakness of SMEs.
This study explored some of the barriers to knowledge sharing from both Riege (2005) and Rosen et al. (2007). Although the results derived from this study are relatively modest, they move the literature forward since, as Riege (2005) points out, there has been no specific research into comparing the barriers of SMEs. There is also no evidence of which barriers are the most common. From the results it can be seen that no respondent suggested any other barriers that were not already listed. However, there were a few barriers that were rated very low, by both SMEs, and this questions their validity as potential barriers. These barriers include gender (averaging 1.48 out of 4) and age (averaging 1.58 out of 4).
When analysing the barriers by job role, there were sufficient differences in some roles. For example, Company A’s middle management mentioned similar factors to their senior management, whereas Company B’s middle management highlighted experience and educational barriers. This would almost certainly reflect the different company structures and management roles in each SME. Another finding was that the Company B factory roles, which would be classed under ‘other’, rated the highest barrier as interpersonal skills, averaging 3.2 out of 4. This can be seen as either the factory roles not appreciating each others’ interpersonal skills or not appreciating the management’s interpersonal skills, which could show a lack of understanding between the two roles. This would also backup the observations, which show different group behaviours and the follow up interviews, which noted the physical knowledge sharing barriers of putting boots on or washing hands prior to management-worker face-to-face contact.
A final perspective is that of Barber et al. (1989) who pointed out that SMEs need to share knowledge to survive, but from a labour turnover perspective. They write that the loss of knowledge, due to an employee leaving, can be minimised if there is a high level of knowledge sharing. The findings of this study make a useful addition by showing how the different roles within SMEs share knowledge, including for how long and how often. Results regarding the barrier of not sharing due to job security fears, which was rated very low in both SMEs, is a positive reflection of the companies. This suggests that the majority of employees see their job as long term, rather than Barber et al.’s (1989) short term view. However, it is very unlikely that this long term view is shared by all SMEs, due to the current economic climate.
6. Recommendations
Not withstanding the limitations of the study in terms of the size of the sample, the study has drawn attention to the types of knowledge sharing facilities used by employees in these SMEs. By determining which ones are used or favoured by the employees’, SMEs such as Company A and Company B, can look to improve those facilities by increasing their accessibility. Reasons why each facility was important to the employees were also emphasised, so, by ensuring that these factors are met, the facility can be setup to meet and exceed the employee’s expectations.
By reviewing how different roles share knowledge, companies can address potential problems or help encourage certain job roles to share more of their knowledge. For example, some roles may feel that their knowledge is not very useful to anyone, due to their role being largely fixed (e.g. secretary/administration). However, there is the possibility that these roles could form a valuable community of practice to help improve processes within the company.
With regards to specific recommendations for Company A, it is clear that they have good comfortable facilities for both formal and informal conversations. However, they need to address some of the potential barriers highlighted, such as a lack of time and transparent rewards. It could also be recommended that they make more time available to utilise their knowledge sharing facilities. The differences in experience appears to be reasonably set due to students leaving each year, yet through adopting a coaching or mentoring approach they may be able to lower these knowledge sharing barriers.
Company B also faces the same problem with experience and has some physical barriers preventing face-to-face knowledge sharing. By ensuring that these physical barriers, such as washing hands, are quick and easy processes, Company B can help encourage more knowledge sharing. Further to this, it can be seen that there is a need for a deliberate knowledge sharing facility at Company B as the majority of employees highly rate the corridor/reception and drinks machine. Even if this is just a small group of seats around a coffee machine, the effects might help decrease the barriers highlighted and bring together the two groups of employees on each floor.
Overall, the paper demonstrates the need to assess the organisation’s knowledge sharing barriers and facilities. By developing a better understanding of these issues, SMEs can work towards solutions to enable better knowledge sharing.
Argote, L., McEvily, B. and Reagans,
R., 2003. Managing knowledge in organisations: An
integrative framework and review of emerging themes. Management Science, 49(4), 571–582.
Barber, J., Metcalfe, J.S. and
Porteous, M., 1989. Barriers to growth in small firms,
Basly, S., 2007. The
internationalization of family SME: An organizational learning and knowledge
development perspective. Baltic Journal
of Management 2(2), 154-180.
Beijerse, R. P., 2000. Knowledge
management in small and medium-sized companies: Knowledge management for
entrepreneurs. Journal of Knowledge
Management, 4(2), 162-179.
Boisot, M., 1995. Information Space: A framework for learning
in organisations, institutions and culture.
Dangelico, R. M., Garavelli, A. C.
and Petruzzelli, A., 2008. Knowledge creation and transfer in local and global
technology networks: A system dynamics perspective. International Journal of Globalisation and Small Business, 2(3),
300-324.
Davies, M., 2007. Doing a successful research paper: Using
qualitative or quantitative methods.
Department for Business
Desouza, K.C. and Awazu, Y., 2006.
Knowledge management at SMEs: five peculiarities. Journal of Knowledge Management, 10 (1), 32-43.
Gupta, K. S., 2008. A comparative
analysis of knowledge sharing climate. Knowledge
and Process Management, 15(3), 193.
Leidner, D., Alavi, M. and Kayworth,
T., 2006. The role of culture in knowledge management: A case study of two
global firms. International Journal of
e-Collaboration, 2(1), 17-40.
Powell, P., Levy, M. and Loebbecke,
C., 2003. SMEs, co-opetition and
knowledge sharing: The role of information systems. European Journal of Information Systems, 12(1), 3-17.
Lin, F. and Hsueh, C., 2006.
Knowledge map creation and maintenance for virtual communities of practice. Information Processing & Management,
42(2), 551-568.
Love, P., Fong, P. and Irani, Z., (eds.)
2005. Management of knowledge in project
environments.
McAdam, R., and Reid, R., 2001. SME
and large organisation perceptions of knowledge management: comparisons and
contrasts. Journal of Knowledge Management,
5(3), 231-241.
Petruzzelli, A. M., Albino, V. and Carbonara, N., 2007.
Technology districts: proximity and knowledge access. Journal of Knowledge Management, 11(5), 98-114.
Petruzzelli, A. M., 2008. Proximity
and knowledge gatekeepers: The case of the Polytechnic University of Turin. Journal of Knowledge Management, 12(5),
34-51.
Riege, A., 2005. Three-dozen
knowledge sharing barriers managers must consider. Journal of Knowledge Management, 9(3), 18-35.
Rosen, B., Furst, S. and
Supyuenyong, V., Islam, N. and
Kulkarni, U., 2009: Influence of SME characteristics on knowledge management
processes: The case study of enterprise resource planning service providers. Journal of
Vos, J. P.,
Yin,
R. K., 2003. Case study research: Design
and methods.
About the Authors:
Jon Staplehurst recently graduated from
Dr. Gillian Ragsdell combines her industrial experience with her academic interests to build on the relationship between the theory and practice of knowledge management. Her origins in systems thinking and creative problem solving have proved particularly effective in studying the generation and sharing of knowledge. Action research projects have taken her into various organisations; recent examples include organisations from the voluntary sector, the water industry and the military.
Jon Staplehurst, Graduate, Department of Information Science,
Dr Gillian Ragsdell, Lecturer, Department of Information Science, Loughborough University, Loughborough, Leicestershire, LE11 3TU, UK; Email: g.ragsdell@lboro.ac.uk