Strategic Deployment Of Knowledge Workers: A Case Study
Santanu Roy and Jayanthi Ranjan,
Institute of Management Technology, Ghaziabad, India
ABSTRACT:
In India, scientific and technological research being carried out in the government sector is concentrated primarily within the laboratories under the Council of Scientific and Industrial Research (CSIR), the primary umbrella for such laboratories. Planning and decision-making at the corporate level of CSIR, therefore, necessitates organizing information regarding the structure and functioning of the knowledge workers, the scientific personnel working in the laboratories of CSIR. These knowledge workers are strategic assets for CSIR, more so because of the tacit knowledge they possess as a result of actively pursuing R&D activities in different functional areas over long periods of time. The present study investigates into the structure and functioning of scientific personnel in CSIR. It analyzes the specific functions carried out by this set of knowledge workers across the various laboratories of CSIR in order to know the internal strengths and weaknesses of individual laboratories in different functional areas. For analyzing such categorical data, the methodology of correspondence analysis has been used. Using this methodology, the structure of multivariate relationships among the different CSIR laboratories in terms of the functions performed by the scientific personnel in these laboratories has been explored.
Keywords: Knowledge workers, Technology manpower, Strategic deployment, Multivariate analysis
Introduction
In India, scientific and
technological research is concentrated in industrial and government funded
institutions such as the Council of Scientific and Industrial Research (CSIR),
where the demand for profit, growth and accountability respectively require
that research activity is directed, at least in the long run and more often in
the short run, towards the solution of practical problems. Further, it is directed primarily towards the
general objectives of social and economic development and national
security. These external tasks provide
to a great extent the stimuli, growth and justification of scientific
work. The traditional task of individual
researcher to determine what scientific questions he wishes to pursue are being
significantly affected by the requirements of funding agencies, as well as by
the change in the organizational structure of R&D.
From the beginning, research on managing R&D has encompassed the innovations that result from it. This has helped to identify key contributions to success, such as good communication, effective project management, understanding user needs, and integration of basic research results (Brockhoff et al, 1997). Further, it could be argued that there has been a change in the way of production of scientific and technical knowledge in recent times. If there is a fundamental change in the mode of knowledge production, it is likely to lead to a reorientation of the R&D practices and organizations. If these changes are pervasive across fields of scientific and technical activity, they would affect the research and innovation systems. The key change is that scientific and technical knowledge production is becoming a less self-contained activity. In many leading-age areas of research, several different skills are required in order to solve problems.
There are very few systematic studies linking management practices to innovativeness outcomes for the entire R&D unit. Learning approach (Senge, 1990a; 1990b) has been found to be crucial to the process of innovation in some studies (Van de ven and Polley, 1992). Greve’s (1998) study has used learning theory to examine how performance feedback affects the probability of risky organizational changes that are consequential to an organization’s performance. The theory predicts how decision-makers interpret organizational performance by comparing it with historical and social aspiration levels. Since organizational learning is driven by a recursive relation between performance and goals (Lant, 1992), it is important to establish exactly what fraction of the total information derived from previous experience are actually taken into account in the decision-making activity. Organizations typically converge around a prevailing archetype strategic orientation and inertia tends to bind the organizational change to that which is consistent with the archetype representing first order change (Fox-Wolfegramm et al, 1998).
Shukla (1997) has looked at the Indian scenario since the economic reforms of early 1990’s. According to him, the knowledge-based organization aims at creating a new paradigm that is possible by developing competencies and capabilities. This requires a change in the mindset of people about the nature of the organization. The challenge, therefore, is to learn new ways of operation. Today’s turbulent environment requires organizations to modify and extend their traditional approach to change in order to respond to increasing complexity and uncertainty. In the present scenario of globalization an international competition an additional significance for the developing countries like India is the thrust needed to be given to the strategic development of technology management. Indigenous technology capability building can effectively enable these countries to compete in the international market. As business environments become more dynamic through deregulation, increased competition and technological changes, organizations face increasing pressures to become more organic (Nilakant and Ramnarayan, 1998). The critical role of R&D management, therefore, cannot be underestimated. Maintaining credibility will require R&D managers to leverage internal R&D capabilities with external resources, to deliver long-term as well as short-term value, to facilitate rapid learning, and to focus on speed in the commercialization of new technology.
Council Of Scientific And Industrial Research
(CSIR), India
The CSIR is an autonomous society
under the Societies’ Registration Act, 1860 with the Prime Minister of India as
its ex-officio President. The Governing
Body is the highest policy decision-making body of CSIR. The Director-General is its ex-officio
chairman. The CSIR Headquarters at New Delhi coordinates the activities of the
laboratories. The Council enters into bilateral agreements in the fields of
pure as well as applied sciences with scientific organizations of various
countries.
Tacit Knowledge And Sustainable Competitive Advantage
The scientific and technical manpower of CSIR is a strategic resource of the organization. The existing theorizing within the strategic human resource management domain requires to be complemented by an evolutionary perspective on the creation of human resource competencies. Grundy (1997) has argued for a strategic approach towards human resource management. In the dynamic and often hyper-competitive R&D environment, sustainable competitive advantage is the key to survival. According to Porter (1990), there are four broad attributes that are determinants of competitive advantage: (i) factor conditions (skills, infrastructure, etc.); (ii) demand conditions; (iii) related and supporting industries; and (iv) the firm strategy, structure and rivalry. These attributes form a mutually reinforcing system in which the effect of one depends on the state of others. Sustainable competitive advantage is based on strategic position, strategic capability or both (Ghemawat, 1986), and depends on organization-specific resources that cannot be easily duplicated (Barney, 1989). This is true particularly in high technology areas, characterized by high levels of change, where strategic position is helpful but not sufficient to sustain competitive advantage. Rather, strategic capability becomes the basis of sustainable competitive advantage in these turbulent environments (Rhyne and Teagarden, 1995). Hamel’s (1998) argument of strategy innovation is supportive of this viewpoint. According to him, in a discontinuous world, strategy innovation is the key to wealth creation. Strategy innovation is the capacity to re-conceive the existing industry model in ways that create new value for customers, wrong-foot competitors, and produce new wealth for all stakeholders. It stresses upon resource creation, vital for success in the face of resource disadvantages. However, according to him, strategy is emergent. By creating the right set of preconditions, one can provoke emergence of strategy innovation.
The advances in the resource-based view (RBV) has helped us to understand the conditions under which human resources become scarce, valuable, organization-specific, difficult-to-imitate resources, that is, strategic assets. Goold (1996) has called this a resource-based theory of the organization (RBT) that provides a theoretical explanation of why some firms outperform others over long periods of time. Planned strategies represent decision-making in the rational mode whereas emergent strategies represent decision-making under conditions of bounded rationality (Slevin and Covin, 1997). Hsiao and Omerod (1998) have explored the dynamic nature of information technology enabled strategic change by using empirical evidences from a variety of organizational contexts. It is clear that the CSIR would have to contribute in a significant way to this wealth creation.
The scientific and technical personnel, the knowledge workers, are strategic assets for CSIR, more so because of the tacit knowledge they possess as a result of actively pursuing R&D activities in different functional areas over a long period of time. Tacit knowledge has been recognized as a major input to any technological innovation effort. The strategic technological agenda is linked to the organization’s technical and managerial knowledge and assumptions. This knowledge is largely experiential, cumulative and often tacit. Much of this tacit knowledge is held in decentralized units and structures, often non-disseminated and immune to external challenge (Pitt and Clarke, 1997). Studies of innovation, technology transfer and technology diffusion identify tacit knowledge as an important component of the knowledge used in innovation. Tacit knowledge is a source of competitive advantage. Dutta and Weiss (1997) have argued that the protection of tacit technological knowledge from potential opportunism is of importance to technologically innovative organizations. Tacit know-how has become recognized as playing a key role in organizational growth and economic competitiveness. It forms an important element in an organization’s knowledge base and has a central role in organizational learning (Howells, 1996). Focusing on research organizations, Alexeis and Mitra (2007) have pointed out that contextual complexities as a result of the nature of knowledge-based resources of organizations are increasingly the bases of competitive advantage. According to Pimentel and Albino (2010), the search for competitive advantage in a global environment must consider the use of tacit and explicit knowledge circulating inside companies. The generation of tacit knowledge is an inevitable adjunct to advances in science and technology, and organizations acquire such knowledge to support innovation in a purposive manner. In the study presented in this paper, we have used functions being performed by the scientific manpower as indicators of their tacit knowledge.
Human resources are considered to be
one of the key strategic assets. They
cannot be easily imitated. Yet,
traditional human resources strategy offers little concrete guidance to
practicing managers on the process of developing human resources - and in the
context of a strategic plan. Knowledge
is an important factor for achieving a sustainable competitive advantage and it
can be harnessed by focusing on increasing human capabilities through the
process of increased communication, cooperation and linkages, both within the
organization as well as across different knowledge producing organizations
Earlier studies on CSIR manpower reported by the authors focused on forecasting
of scientific manpower (Roy et al, 2001), and on measuring scientific
productivity (Roy et al, 2007). However,
strategic human resource planning and development involves linking business
strategy and organizational strategy to the current and emerging pool of skills
and competencies, thus identifying key shifts and gaps and areas for
intervention. This involves developing
future business and organizational mini-scenarios, examining possible options
for organizational structure change and generating stretching ideas on developmental
moves for resource personnel.
The Present Paper
The study investigates into the deployment of knowledge workers in the
laboratories of the Council of Scientific and Industrial Research (CSIR). The knowledge workers are the scientific
personnel working in different field of activities like research and
development, infrastructure, workshops and engineering and design units of the
various CSIR laboratories. The work is
carried out through a study of the structure and functioning of scientific
personnel in CSIR. It analyzes the
specific functions carried out by this set of manpower across the laboratories
of CSIR. The study thus explores whether
the scientific and technical manpower have been deployed strategically in CSIR.
Methodology
Functional
Scheme For Scientific And Technical (S&T)
Personnel
Based on our understanding of the
various scientific activities being carried out in CSIR laboratories, the
different functions carried out by these personnel were grouped into six
categories, defined as follows:
Functional Scheme For
S&T Personnel
|
Function 1 |
Research and development work. |
|
|
|
|
Function 2 |
S&T services including testing, survey, data processing, field work, liaison, planning and co-
ordination. |
|
|
|
|
Function 3 |
Infrastructure including workshop, animal house, instrumentation,
equipment maintenance, special functions such as glass blowing, printing and
reprography, etc. |
|
|
|
|
Function 4 |
Pilot plants, experimental field stations and Demonstration units. |
|
|
|
|
Function 5 |
Engineering and design units. |
|
|
|
|
Function 6 |
Research support functions. |
It may be mentioned here that what we see in the functional scheme for scientific personnel is actually a complex system of organizational and social relationships. These functions are in the main activities performed by different scientific groups in the CSIR laboratories. Some of these are specialized functions. These functions are not independent but are related to the functions of research and development.
We have not made an attempt here to divide the functions performed by the scientific personnel into different categories of structured and less-structured functions. The scheme outlined above reflects the actual scientific staffing pattern in various CSIR laboratories. A group of personnel in a particular category may perform some structured functions and some functions which are not so structured.
It may be noted that function 2 and function 6 are not same. Function 6 (research support functions) includes all residual functions not mentioned in the list of other functions. Scientific personnel categorized under this functional classification could include computer programmers, data entry operators and the like.
Data from 31 CSIR laboratories were available for this study. For the sake of confidentiality, only arbitrary abbreviations have been used in place of the names of the laboratories. For analyzing such categorical data, the methodology of correspondence analysis has been used.
Correspondence
Analysis (CA)
Correspondence analysis is an exploratory statistical study which displays the rows and columns of a rectangular data matrix as points in a scatter-plot, often called a ‘map’. It is powerful graphical tool in many situations involving categorical data (Lebart et al, 1984; Greenacre, 1984; Greenacre, 1993; Greenacre and Blasius, 1994). The data set is in the form of categorical variables in a contingency table. The important characteristics of a contingency table is that each respondent, or sampling unit, occurs in only one cell of the table, so that the grand total of the table is equal to the sample size. Correspondence analysis looks at the association, or interaction, between two categorical variables. The maps of correspondence analysis provide a view of a data table in a continuous framework, in terms of new dimensions on continuous scales. The methodology is particularly helpful in analyzing cross-tabular data in the form of numerical frequencies, and results in an elegant but simple graphical display that permit more rapid interpretation and understanding of the data. In our present study, correspondence analysis has been carried out using SIMCA-2 (Greenacre, 1990) software.
Correspondence analysis is an extremely useful tool in the strategic planning and management of R&D. Unlike traditional approaches to typological analysis (e.g., cluster analysis), this methodology allows for the possibility of overlapping clusters and simultaneous representation of row elements (i.e., laboratories) and column elements (i.e., functions) in two-dimensional factorial maps. Bonitz et al (1995) have applied cluster analysis to the data on publication output and citation impact of 45 countries, using city block distance between countries as metric for cluster analysis. They have produced ‘co-structure cluster maps’ for two time spans. However, these maps do not depict the relationship between the row elements and the column elements nor do they allow statistical comparison. Cliff’s algorithm (1966) could be used for comparison of factorial maps of two time spans, using the program FMATCH (which is a module of the computer program PC-MDS, Multidimensional Statistical Package). The changes in the structure of functional profiles of the laboratories’ scientific and technical manpower between two time spans obtained through correspondence analysis could also be portrayed in a two-dimensional factorial map. For this purpose, one set of data is used as supplementary variables. Supplementary variables do not contribute to the computation of factorial axes. However, the program computes the absolute and relative contributions of these variables. Thus, dynamic changes between the two time spans are transformed into distances between points. However, in the present study the data on the deployment of scientific manpower across the different laboratories of CSIR for two separate time spans were not available, and therefore, this option could not be exercised.
In this study, the structure of multivariate relationships between the CSIR laboratories and the functions performed by the scientific personnel employed therein has been explored. Usually, hierarchical cluster analysis is used for classifying objects into mutually exclusive clusters. Mutual exclusivity is a desirable attribute of classification, but it becomes less important when the classification deals not only with the groups of objects, but also with the structure and relations between objects (Aimetti et al, 1979). Hierarchical cluster analysis has two important limitations. One limitation is that it precludes the possibility of an object to belong to more than one cluster. However, Arabie et al (1981) have developed an algorithm for representing overlapping structure in data, using the additive clustering model. Another limitation is that with this procedure, one can cluster either the row elements or column elements of a data matrix, but not both simultaneously. In this study, the methodology of correspondence analysis, which does not suffer from these limitations, has been used. Furthermore, correspondence analysis allows the representation of column and row elements of the data matrix in low dimensional (usually two-dimensional) subspaces. This representation can be used to reveal the structure and pattern hidden in the data. The two dimension factorial map reveals the main features of the multi-dimensional data. The third factorial axis (and perhaps the fourth axis as well which together with the first three axes might yield the most parsimonious representation of the data) represents complementary data for further analysis.
Data Structure
Data from 31 CSIR laboratories have been analyzed in this study. The laboratories are referred to in the correspondence analysis maps as two capital letter abbreviations.
Table 1 presents the raw data of scientific personnel in different CSIR laboratories categorized into various functions they perform as defined above.
Table 1: Function-Wise Deployment Of Scientific Personnel In Different CSIR Laboratories
|
Name
of the Laboratory |
Function
1 |
Function
2 |
Function
3 |
Function
4 |
Function
5 |
Function
6 |
|
RJ |
131 |
2 |
2 |
6 |
3 |
|
|
IP |
147 |
7 |
5 |
1 |
|
|
|
CP |
38 |
20 |
7 |
29 |
4 |
|
|
CL |
77 |
23 |
3 |
5 |
3 |
1 |
|
CM |
67 |
16 |
4 |
|
2 |
26 |
|
RT |
126 |
6 |
5 |
|
7 |
|
|
CS |
119 |
28 |
2 |
|
|
5 |
|
NM |
105 |
25 |
20 |
20 |
8 |
18 |
|
CE |
155 |
3 |
2 |
|
1 |
|
|
CF |
97 |
31 |
8 |
167 |
|
|
|
IM |
13 |
2 |
2 |
|
1 |
1 |
|
CR |
94 |
7 |
8 |
|
1 |
|
|
NB |
96 |
8 |
|
1 |
|
|
|
IB |
90 |
5 |
9 |
|
|
1 |
|
SC |
30 |
1 |
1 |
|
|
|
|
NE |
127 |
12 |
9 |
|
|
|
|
CI |
156 |
10 |
14 |
21 |
|
|
|
SE |
70 |
5 |
3 |
|
|
|
|
IT |
237 |
23 |
10 |
1 |
19 |
|
|
NG |
177 |
2 |
|
|
|
7 |
|
CC |
51 |
2 |
14 |
|
|
1 |
|
NI |
75 |
2 |
3 |
|
|
|
|
NC |
301 |
12 |
13 |
53 |
2 |
|
|
PL |
16 |
1 |
|
|
|
|
|
CB |
100 |
30 |
10 |
12 |
7 |
5 |
|
NO |
208 |
9 |
3 |
|
|
|
|
NA |
282 |
14 |
8 |
2 |
11 |
7 |
|
IR |
87 |
5 |
1 |
|
|
|
|
CT |
187 |
31 |
10 |
14 |
13 |
11 |
|
NS |
46 |
1 |
|
|
|
|
|
CD |
200 |
33 |
21 |
8 |
|
8 |
Results And
Interpretations
It is observed from Table 2 that function
1 i.e. research and development work, are carried out by a large number of
scientific personnel. It is also observed that scientists are involved in
carrying out all the different kinds of functions as defined above.
Results
of Correspondence Analysis
The program SIMCA-2 (Greenacre, 1990) gives the following output:
a) Eigenvalues of different factorial
axes.
b) Absolute contributions of the row
columns to the composition of each factorial axis.
c) Relative contributions (cos2 ¢) of
each factorial axis to the representation of row and column points in the
direction of the factorial axis.
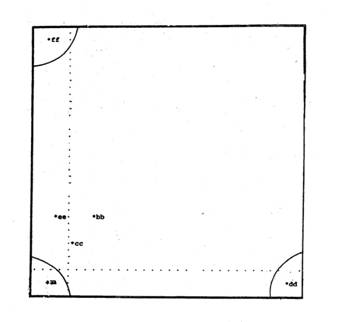
For the correspondence analysis,
function 1 has been represented as aa,
function 2 as bb, function 3 as cc, function 4 as dd,
function 5 as ee, and function 6 as ff.
Keys
To Interpreting The Factorial Maps
Some keys for interpreting the
factorial maps are the following:
1) The
total inertia of a table (i.e., total variance, å li ) quantifies how much variation is present in
the set of row profiles or in the set of
column profiles. In general, while
interpreting the contributions of inertia, one has to take into account the
fact that the masses of the variables are included as multipliers. Therefore, a high contribution of inertia can
be due to a high mass only, whereas a low contribution of inertia does not
allow the conclusion that the variable category is poorly correlated with the
axis.
2) The
centre of gravity (barycentre) located at the origin
of the axes corresponds to the average profiles of both sets of points (that
is, functions and laboratories), i.e., ‘typical’ profile of the
multi-dimensional system. The points far
away from the barycentre have ‘specific’ or
‘atypical’ profiles. In the full space,
the points closest to the centre resemble the average profiles the most. In the reduced space, points closest to the
centre are:
a) close to the
average in the full space; or
b) perpendicular
to the display plane.
The higher the percentage of variance
accounted by the first two factorial axes, the surer we are that possibility
(a) is the true state of affairs (Greenacre, 1991).
3) Two
elements of a given space (i.e., two laboratories) are all the more
inter-related to the conjugate space (i.e., functions) as they are near one
another and far from the origin, i.e., they have similar profiles. On the other hand, the greater the distance
between these points, the more different are their functional profiles. The same relationship also holds true for two
functions.
4) Two
elements belonging to different spaces (laboratories and functions) are all the
more inter-related as they are near each other and far from the origin.
Elements far from each other have little or no relationship. However, the theoretical parameters (viz.
absolute contribution, relative contribution, i.e., cos2 ¢) are
required to be examined additionally to validate such relationships (Okubo et
al, 1992). Absolute contributions of one set of points
(say columns) may be used to characterize the dimensions – considering one dimension at a time – and the positions of the other set may be
interpreted along this dimension from the values of the relative contributions,
cos2 ¢ (Greenacre,
1991).
5) When
interpreting the numerical results of correspondence analysis, all information
such as contribution of inertia (ctr), cos2
¢ including their signs and masses have to be considered simultaneously.
Analysis Of
Correspondence Analysis (CA) Maps
While interpreting the maps in the
following sections, the absolute contributions have been represented by the
abbreviation AC and the relative contributions (cos2 ¢) have been
represented by the abbreviation RC.
Figure 1 presents the
two-dimensional map constituted by factor 1 (¢1) and factor 2 (¢2)
axes for the CSIR laboratory points and Figure 2 presents the same for the
various function points that should be read and interpreted
simultaneously. The representation of
functions and laboratories in different maps has been done to avoid cluttering
of the points in the same map. However,
it is possible to superimpose these two maps.
Figure 1: CA Map – Laboratory Points
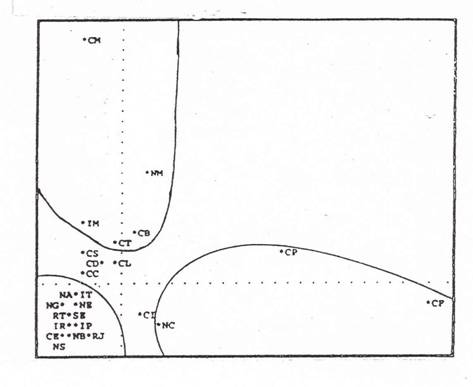
Figure 2: CA Map – Function Points
Figures 1and 2 could be interpreted as follows.
Eigenvalues obtained from the correspondence analysis of the data indicate that the total variance (å li = 0.474769) is quite large, which implies considerable deviations from the average in the profiles of the laboratories as far as their scientific manpower deployment among the various functions is concerned. The first three factorial axes, accounting for 91.07% of the total variance in the multi-dimensional system, yield the most parsimonious representation of the data. The remaining axes, accounting for successively smaller accounts of variance, represent information of an idiosyncratic nature, which does not have much bearing on the structure of the multi-dimensional data. The first two axes, accounting for 83.6% of the total variance, represent the main features of the multi-dimensional data. The third axis, accounting for 7.43% of the variance, represents complementary data for further analysis.
Factor 1 (f1): The first factorial axis, accounting for 62.55% of the total variance, constitutes the most important element of the multivariate structure of relationships between CSIR laboratories and the functional areas of scientific manpower.
On the cloud of functions, the first factorial axis represents a polarity (bi-polar) between function 4 - pilot plants, experimental field stations, etc. and function 1 - R&D work. Function 1 is projected on this axis with negative coordinate, whereas function 4 is projected on this axis with positive coordinate. This implies that laboratories which emphasize R&D work for their scientific personnel and deploy their scientific manpower in this area tend to de-emphasize their work related to pilot plants, etc., and vice-versa.
The numerical results of the correspondence analysis are presented in Tables
2 and 3. Table 2 presents the contribution of the explicative points to the
composition of first three factorial axes (absolute contribution, per mil) and
Table 3 presents the contribution of explained points to the eccentricities of
the first three factorial axes (relative contribution, per mil) for this set of
knowledge workers in CSIR.
Table 2: Contribution Of Explicative Points: The Composition Of The 1st Three Factorial Axes (absolute contribution, per mil)
Cloud Explicative Points with Explicative
Points with
Positive
Coordinates Negative
Coordinates
Axis 1 ( l1
= 0.296976, t1 = 62.55%)
Functions dd (890)
Laboratories CP (660)
CF (752)
Axis 2 (l2 =
0.100152, t2 = 21.09%)
Functions ff (699)
Laboratories CM (484)
Axis 3 (l3 =
0.035258, t3 = 7.43%)
Functions ff (262) bb (281)
ee (284)
Table 3: Contribution Of The
Explained Points: Eccentricities Of The 1st Three Factorial Axes (relative
contribution, per mil)
Cloud Explained Points with Explained
Points with
Positive Coordinates Negative
Coordinates
Axis 1 ((l1
= 0.296976, t1
= 62.55%)
Functions dd (994) aa (736)
Laboratories CP (816) RT(507)
CF (991) NG(479)
NC (424) IP(568)
Axis 2 ((l2 = 0.100152, t2 = 21.09%)
Functions bb (405)
Ff (871)
Laboratories CM (538) CI(340)
CE(363)
SC(342)
NI(340)
RJ(518)
NC(432)
NO(335)
IR(304)
NS(358)
Axis 3 ((l3 = 0.035258, t3 = 7.43%)
Functions bb
(271)
Laboratories NG(467) CL(444)
IT(358) CB(473)
The laboratories projected on this axis can be classified into two clusters, depending upon whether they are projected with positive coordinates (correlated with function 4) or negative coordinates (correlated with function 1).
Cluster 1 (positive coordinates): CP, CF and NC.
Cluster 2 (negative coordinates): RT, NG, IP, CE, CR, NB, IB, NE, SE, NI, PL, NO, NS, NA, IR.
Factor 2 (f2): The second factorial axis, accounting for 21.09% of the total variance, constitutes the second most important element of the multi-dimensional data.
On the cloud of functions, the second factorial axis is unipolar - both function 2 - S&T services including testing, data processing, field work, planning and coordination etc. and function 6 - research support functions, are projected on the axis with positive coordinates. This implies that the laboratories which are projected on this axis with positive coordinates emphasize the function of working in the areas of S&T services and research support functions for their scientific personnel and deploy scientific manpower in these areas whereas laboratories, which are projected with negative coordinates on this axis, de-emphasize these roles for their scientific manpower.
The laboratories projected on the second factorial axis can be classified into two clusters, depending upon whether they are projected on this axis with positive coordinates (correlated with both function 2 and function 6) or negative coordinates (anti-correlated with both function 2 and function 6).
Cluster 1 (positive coordinates): CM, NM, CT, IM, CB.
Cluster 2 (negative coordinates): CI; CE, SC, NI, RJ, NC, NO, IR, NS.
Factor 3 (f3): The third factorial axis accounts for 7.43% of the total variance.
On the cloud of functions, the third factorial axis is a bi-polar axis of function 2 – S&T services including testing, field work, planning and coordination, etc. and function 5 - engineering and design units on one side (projected on this axis with negative coordinates) and the function 6 – research support functions on the other side (projected on this axis with positive coordinates). This implies that laboratories that emphasize the functions of S&T services, planning and coordination, and the work related to engineering and design units for their scientific manpower and deploy this manpower in these areas of work, tend to de-emphasize their work related to research support functions, and vice-versa.
On the cloud of laboratories, it is found that the laboratory NG is projected on the axis with positive coordinate whereas laboratories CL, IT, and CB are projected on the axis with negative coordinates.
Discussion And
Conclusions
In this era of globalization, market-driven economy, and national and international competitiveness of technology and research and development in various sectors, it is imperative to appreciate the paradigmatic shift towards strategy innovation for survival, maintenance and growth of CSIR. The corporate character of CSIR has already been emphasized. The corporate character of CSIR is almost entirely built upon the performances and functioning of the laboratories functioning under CSIR (Banerjee and Roy, 1999). In view of the liberalization and opening up of the economy and the consequent globalization, the term ‘commercial rupee’ (earning by CSIR laboratories from non-governmental sources) has gained in significance. Porter and Detampel (1995) have opined that monitoring is to watch, observe, check and keep up with developments, usually in a well-defined area on interest for a very specific purpose. Monitoring can be conducted as a onetime study of a given topic or an ongoing effort to track developments in that topic. Organizing information of this nature for strategic planning and decision-making for technology-driven organizations like the CSIR therefore assumes criticality. The present study is an attempt to address this problem. Organization of information in this manner could provide the corporate managers and decision-makers at the CSIR level an invaluable input for making policy decisions depending upon the strengths and weaknesses of the laboratories in different functional areas in terms of their scientific and technical manpower – the knowledge workers.
The results of the correspondence analysis presented above would illustrate the point further. Quite often it is found that the laboratories that emphasize R&D work for their scientific manpower pay little emphasis on pilot plants, experimental field stations and in the engineering and design units. But these are exactly the factors critical for technology development in CSIR laboratories and their subsequent transfer, as also adopting a strategy of networking among partners in technological innovation (Roy, 2001; Roy, 2006; Roy and Banerjee, 2007; and Roy, 2009). Thus, CSIR, viewing itself as a corporate, should, therefore, realize its core competencies, and evaluate its strengths and weaknesses in different R&D and allied areas and functions necessary for initiating technological innovation. Training of scientific and technical manpower in different fields of their activities, potentialities and interests could play a vital role in this regard. In a survey of CSIR directors, marketing/business development managers, and senior scientists (Bhojwani and Gupta, 1998), it was observed that there is little systematic planning done to assess the training needs of the scientific personnel. About 38% of the respondents indicated that they themselves have to worry about their own training needs. This observation, if it still persists, needs to be addressed urgently at the corporate strategy level at CSIR.
This study provides us with a map with groupings of laboratories possessing an in-built strength in basic research or an in-built strength in engineering services or in the working of pilot plants or in other R&D thrust areas. The role of tacit knowledge in technological innovation has already been emphasized. What we see in such correspondence analysis maps are displays and profiles of such tacit knowledge in different functional areas. Tacit knowledge is a source of competitive advantage (Choo, 1996). Therefore the significance of the objective of strategic deployment of knowledge workers with such ingrained tacit knowledge cannot be underestimated. For CSIR, viewing itself as a multi-business conglomerate, to pitch in globally in a select few areas of strength and competence through a network mode of consortia of laboratories and other actors in the innovative effort, such an analysis could prove extremely useful and timely. The study results and the correspondence analysis maps are a guide to forge such alliances by identifying strategic groupings of laboratories as also identifying the stand-alone ones. Both basic as well as applied research thrust areas are crucial to any innovative effort.
Upon appreciating how the knowledge workers have been deployed across different laboratories and functional areas, the questions that need to be addressed are: are we satisfied with what we have? What is it that we are looking for regarding strategic deployment of scientific manpower? In which direction do we want it to progress? What are the areas that need strengthening? How do we build on our core competency and our tacit knowledge base? Which areas need specialized attention? The study aims at opening up the areas of concern and despair – where targeted and concentrated training programmes could help s turn around the tide and progress on the path of growth, as also the areas of consolidation. Going for strategy innovation, however, is never easy for an established organization like the CSIR. According to Markides (1998), compared to new entrants or niche players, established organizations find it hard to innovate because of structural and cultural inertia, internal politics, complacency, fear of cannibalizing existing forms of outputs, fear of destroying existing competencies, satisfaction with the status quo, and a general lack of incentive to abandon a certain present (which is profitable) for an uncertain future. He has highlighted two specific tactics that established organizations can use to achieve innovation in their strategic thinking and planning: (1) challenge the accepted strategic planning process, and (2) institutionalize a questioning attitude. The task of devising strategy involves determining one’s (potential) source of competitive advantage (Price, 1996). CSIR must recognize that its source of competitive advantage is its own scientific and technical manpower. Knowledge is not only codified but also tacit, and, therefore, mobility of scientific and technical manpower across R&D laboratory organizational boundaries within a consortium of laboratories or a network of laboratories under a technological mission must not only be permitted but also encouraged and promoted.
Keeping in mind the increasing trend towards globalization and a competitive R&D environment, the corporate objectives of CSIR and of the national priorities, this assessment of the strengths and weaknesses of CSIR regarding the functional deployment of its knowledge workers across the different laboratories could prove immensely useful to the decision-makers in R&D strategy formulation, planning and management. Scientific manpower, the knowledge workers, are the primary strategic resource for CSIR, and this strategic asset should be utilized in conjunction with other organizational assets to sustain the resource position and competitive advantage of CSIR.
References
Aimetti, J.P., Visart, N. and Gainche, C.Y. (1979), The Utility of Using Different Typologies of Research Units to Understand their Functioning and Management, R&D Management, 9: 193-206.
Alexeis, G.P. and Mitra, A. (2007), Electronic Journal of Knowledge Management, 5(4): 373-385.
Arabie, J.D., Carrol, W., De’Sarbo, J. and Wind, J. (1981), Overlapping Clustering: A New Methodology for Product Positioning, Journal of Marketing Research, 18: 301-317.
Banerjee, P. and Roy, S. (1999) Social Partnership
and Network: CSIR in Business, in Bagchi, A. K.
(ed.), Economy and Organization:
Indian Institutions under the Neo-Liberal Regime, ISBN: 0-7619-9333-9 (US-hb), 81-7036-798-0
(India-hb), Sage Publications, New Delhi: 350-397.
Barney, J.B. (1989), Firm Resources and Sustainable Competitive Advantage, Journal of Management, 17: 99-120.
Bhojwani, H.R. and Gupta, A.K. (1998), Management of Publicly Funded R&D in India: Case Study of CSIR, Council of Scientific and Industrial Research, New Delhi.
Bonitz, M., Bruckner, E. and Scharnhorst, A. (1995), Country Maps through Co-Structure Clustering, Science and Science of Science, 3: 5-13.
Brockhoff, K.K., Koch, G. and Pearson, A.W. (1997), Business Process Re-Engineering: Experiences in R&D, Technology Analysis and Strategic Management, 9(2): 163-178.
Choo, C.W. (1996), The Knowledge Organization: How Organizations Use Information to Construct Meaning, Create Knowledge and Make Decision, International Journal of Information Management, 16(5): 329-340.
Cliff, N. (1966), Orthogonal Rotation to Congruence, Psychometrica, 31: 33-42.
Dutta, S., Wiess, A.M. (1997), The Relationship Between a Firm’s Level of Technological Innovativeness and its Pattern of Partnership Agreements, Management Science, 43(3): 343-356.
Fox-Wolfegramm, S.J., Boal, K.B. and Hunt, J.G. (1998), Organizational Adaptation to Institutional Change: A Comparative Study of First-Order Change in Prospector and Defender Banks, Administrative Science Quarterly, 43: 87-126.
Ghemawat, P. (1986), Sustainable Advantage, Harvard Business Review, 64(5): 53-58.
Goold, M. (1996), Parenting Strategies for Multi-Business Companies, Long Range Planning, 29(3): 419-421.
Greenacre, M. and Blasius, J. eds. (1994), Correspondence Analysis in the Social Sciences: Recent Developments and Applications, Academic Press, London.
Greenacre, M.J. (1984), Theory and Applications of Correspondence Analysis, Academic Press, London.
Greenacre, M.J. (1990), SIMCA-2: Program and Manual, Department of Statistics, University of South Africa, Pretoria, South Africa.
Greenacre, M.J. (1991), Interpreting Multiple Correspondence Analysis, Applied Stochastic Models and Data Analysis, 7: 195-210.
Greenacre, M.J. (1993), Correspondence Analysis in Practice, Academic Press, London.
Greve, H.R. (1998), Performance, Aspirations, and Risky Organizational Change, Administrative Science Quarterly, 43: 58-86.
Grundy, T. (1997), Human Resource Management: A Strategic Approach, Long Range Planning, 30(4): 507-517.
Hamel, G. (1998), Opinion, Strategy Innovation and the Quest for Value, Sloan
Howells, J. (1996), Tacit Knowledge, Innovation and Technology Transfer, Technology Analysis and Strategic Management, 8(2): 91-106.
Hsiao, R.L. and Omerod, R.J. (1998), A New Perspective on the Dynamics of Information Technology Enabled Strategic Change, Information Systems Journal, 8: 21-52.
Lant, T.K. (1992), Aspiration Level Adaptation: An Empirical Exploration, Management Science, 38: 623-644.
Lebart, L., Morineau, A. and Warwick, K.M. (1984), Multivariate Descriptive Statistical Techniques, John Wiley and Sons, New York.
Markides, C. (1998), Strategic Innovation in Established Companies, Sloan Management Review, Spring: 31-42.
Nilakant, V. and Ramnarayan, S.
(1998), Managing Organisational
Change, Response Books, New Delhi.
Okubo, Y., Miquel, J.F., Frigoletto, L. and Dore, J.C. (1992), Structure of International Collaboration in Science: A Typology of Countries through Multivariate Techniques, Using a Link Indicator, Scientometrics, 25: 321-351.
Pimentel, A.C.M. and Albino, J.P. (2010), An Approach for Implementing Knowledge Management in Small and Medium Enterprise in Brazil, in Proceedings of the European Conference on Knowledge Management, pp. 647-652.
Pitt, M. and Clarke, K. (1997), Frames of Significance: Technological Agenda Forming for Strategic Advantage, Technology Analysis and Strategic Management, 9(3): 251-269.
Porter, A.L. and Detampel, M.J. (1995), Technology Opportunities Analysis, Technological Forecasting and Social Change, 49: 237-255.
Porter, M.E. (1990), The Competitive Advantage of Nations, Macmillan, London.
Price, R.M. (1996), Technology and Strategic Advantage, California Management Review, 38(3), Spring: 38-56.
Rhyne, L.C. and Teagarden M.B. (1995), International Technology-Based Competitive Strategy: A Literature Review and Integrative Model, The Journal of High Technology Management Research, 6(2): 157-178.
Roy, S. (2001) Networking Strategy for Innovative Technologies in Rural India, Journal of Rural Development, 20(4): 693-710.
Roy, S. (2006) Networking as a Strategy for Technology Transfer and Commercialization from R&D Laboratories, Industry and Higher Education, 20(2): 123-133.
Roy, S. (2009) Technology Transfer from R&D Centres in India and Development of Industrial Clusters, in Manimala, M.J., Mitra, J. and Singh, V. (eds.), Enterprise Support Systems: An International Perspective, ISBN: 978-81-7829-927-3, Sage, New Delhi: 217-227.
Roy, S. and Banerjee, P. (2007) Developing Regional Clusters in India: The Role of National Laboratories, International Journal of Technology Management and Sustainable Development, 6(3): 193-210.
Roy, S., Gupta, B.M. and Kumar S. (2007) Exploring Scientific Productivity and the Impact of Age, Research Area and Rank: Case of CSIR, India, Journal of Information Management and Scientometrics, 3(1): 16-26.
Roy, S., Jain, A. and Mohapatra, P.K.J. (2001) Forecasting and Simulation of Scientific Manpower under Various Policy Regimes: Case Study of an R&D Laboratory in India, Manpower Journal, XXXVII(1): 23-45.
Senge, P. (1990a), The Fifth Discipline, Doubleday/Currency, New York.
Senge, P. (1990b), The Leader’s New Work: Building Learning Organizations, Sloan Management Review, 32(1): 7-23.
Shukla, M. (1997), Competing through Knowledge: Building a Learning Organization, Response Books, New Delhi.
Slevin, D.P. and Covin, J.G. (1997), Strategy Formation Patterns, Performance and the Significance of Context, Journal of Management, 23(2): 189-209.
Van de ven, A., Polley, D. (1992), Learning While Innovating, Organization Science, 3, pp. 92-116.
Contact the Authors:
Santanu Roy, Institute
of Management Technology, Hapur Road, Raj Nagar,
Ghaziabad 201 001 India. Email:
sroy@imt.edu; rsan58@yahoo.co.uk
Jayanthi Ranjan, Institute of Management Technology, Hapur Road, Raj Nagar, Ghaziabad 201 001 India. Email: jranjan@imt.edu