Decision Support For The Development Of
Green Growth Tourism Strategies: Managing Complexity
G. Michael McGrath, Alexandra Law, Terry De
Lacy, Victoria University , Melbourne ,
Australia
ABSTRACT:
The term ‘green growth’ refers to a system whereby material wealth is realized with due regard to environmental and social factors. Development of appropriate green growth policies is a complex task and, consequently, decision support technologies can be used to advantage here. The design and use of one such tourism destination decision support system is described in this paper. Key features of the system are that it facilitates the effective management of the inherent complexity of the analysis domain and allows iterative development with minimum impact on previous versions.
Keywords: Decision support, Green growth, Tourism,
Managing complexity
1. Introduction
An increasing number of tourism destinations have investigated the adoption of ‘green’ strategies as a means of addressing a variety of critical issues (Scott et al., 2008). These include: i) climate change; ii) severe environmental and social problems such as pollution, critical energy, water and land shortages, acute traffic congestion and rising unemployment and crime rates; iii) the need to rejuvenate destinations that have reached the decline stage of their life-cycles; and iv) an apparent willingness on the part of visitors to pay a premium where sound environmental practices are employed (Hawkins and Bohdanowicz, 2011).
Development of appropriate strategies is, however, not a simple matter. In part, this is because the policy development process demands that a substantial volume of data be analysed. In addition, the policy domain contains a large number of variables, covering the economic, environmental and social dimensions, with variables interacting with each other in a complex myriad of ways; i.e a classic case of a “wicked’ or ‘messy’ problem (Vennix, 1996).
Obviously, information technology can assist in managing this complexity and, in addition, the analytical tools, scenario generation functionality and simulation capabilities characteristic of modern decision support systems (DSSs) can be used to advantage in evaluating the possible impacts of proposed strategies. This assumes, however, that required data can be captured, organized and accessed conveniently. Moreover, given that an iterative approach is required for DSS development and maintenance (because of the need to apply the software sequentially in a range of destinations), the system design must allow for convenient modification with minimum impact on previous versions.
In this paper, the design and application of a DSS that meets these
requirements is detailed. The system is called GETS (Green Economy Tourism System) and, to date, it has been
applied in the field in separate studies at two locations; Sharm El Sheik in
The paper is organized as follows: some necessary background is presented in
the following section. The research approach is then overviewed and this is
followed by a discussion of the system architecture and the framework employed
to integrate system models at different levels of detail. The
2. Background
2.1. Green
Growth Tourism
Currently, tourism is estimated to contribute around 5% to the world’s total anthropogenic greenhouse gas (GHG) emissions (Scott et al., 2008; WEF, 2009). Worse still, estimates show that tourism’s GHG emissions could grow by 161% by 2035 in a ‘business as usual’ scenario (Scott, et al., 2008). In the context of global decarbonisation trends, such estimates highlight the need for climate change mitigation and adaptation in the tourism sector and emphazise the need to adopt a more sustainable path.
Of course, all industry sectors (and society in general) stand to be impacted substantially by climate change (UNEP, 2010). However, tourism faces some unique challenges and must contend with a number of specific factors and variables. These include:
v Tourism is highly energy-intensive which, as noted above, strongly suggests that action be taken to minimize GHG emissions.
v Gossling (2005) asserts that direct water use in tourism varies substantially, ranging between 100-2,000 litres per guest night. High water usage tends to be in resort-style hotels and, in particular, those with golf courses.
v Tourists tend to generate more waste than the population at large (see e.g. Hamele and Eckhardt, 2006). UNEP (2010) estimate that higher rates of waste recycling and recovery could reduce global net waste disposal by 57 million tonnes by 2050.
v Among visitors, destination choice is increasingly being influenced by green growth commitment. For example, according to a TripAdvisor survey, 38% of travellers stated that environmentally-friendly tourism influenced their choice of destination, 38% had stayed at an environmentally-friendly hotel and 34% were willing to pay more to stay in these (Hawkins and Bohdanowicz, 2011). While the precise economic benefits that result from destination commitment to green growth and sustainability are difficult to quantify at this point, there is an increasing body of evidenced that suggests that the phenomenon does indeed exist (see e.g. Naidoo and Adamowickz, 2005).
Furthermore, green growth tourism planning is a complex process, characterized by high levels of uncertainty. For targeted adaptation strategies, the relationships and interdependencies between the green economy drivers must be understood. However, a planning framework (of this type) for a green economy transition in tourism destinations does not currently exist. In addition, the domain is extremely complex, making strategy development even more difficult. We turn our attention to this important aspect in the following (sub) sections.
2.2. Domain
Complexity
The green growth tourism domain is extremely complex. Reasons include:
v A large number of variables must be considered. These encompass the economic, environmental and social dimensions, and interactions between variables (within and between dimensions) need to be taken into account.
v The problem domain is ‘messy’, defined by Vennix (1996) as characterized by complexity, uncertainty, interrelated sub-problems, recursive dependencies and multiple interpretations of the problem’s essence.
v Strategic, scenario planning must be supported by a substantial volume of data, all of which needs to be modelled, captured, structured and stored in a way in which it can be conveniently retrieved and utilized.
v There are substantial differences between destinations in terms of their size. These range from global regions to small, local areas. Hence, it is imperative that the DSS is ‘scaleable’ – a non-trivial issue (Mueller et al., 2009).
We now turn our attention to the issue of managing this domain complexity in the design and development of the GETS DSS.
3. Managing
Complexity In IS Design And Development
The information systems (IS) field is not primarily about the production of computer software: it is about the modelling and analysis of the processes, functions and data that are of relevance in whatever domain is of interest (DeMarco, 1978). From the origins of the very first modern IS (circa 1960s), these ‘domains of interest’ have become increasingly complex.
Most approaches to managing complexity in IS design and development rely to some extent on modularization – i.e. breaking down a problem into more manageable subparts. Serious attempts at specifying rigorous and systematic methods for accomplishing this were reported as early as the 1960s (see e.g. Dijkstra, 1968). Functional decomposition and data flow diagrams (DeMarco, 1978) proved to be particularly popular methods for breaking down processes into smaller units and remain so to this day. On the data side, abstraction and generalization (Feldman and Miller, 1986) have been put forward as one approach to decomposing entity-relationship diagrams (Chen, 1976) and, more recently, object-oriented techniques allow data and processes to be broken down and levelled as a unified whole.
Reference was made earlier to the holistic nature of the tourism domain and the importance of taking a systemic approach to the analysis of any combination of variables. System dynamics (SD) (Maani and Cavana, 2000) is very well-suited to this task and many (but not all) GETS models have been specified and implemented using SD techniques and software packages. The mapping approach outlined later in this paper facilitates decomposition of GETS SD modules. There are a number of examples of where SD has been used effectively in the tourism domain, an excellent example being the destination management simulation package developed by Walker et al. (1999).
The degree of complexity of a given problem domain will correspond (roughly) exponentially with the number of variables involved and, as noted, the green tourism domain is extremely complex. Management of this complexity is, of course, the central issue to be addressed in the remainder of this paper. Before that, however, we briefly introduce our research approach.
4. Research
Approach: Summary
The following is a brief summary of the research approach, which is based on the idea that development of an IS may, in certain circumstances, be considered a legitimate research strategy in its own right. A more complete account is presented in (Pornphol and McGrath, 2012) and that account, in turn, borrows heavily from earlier work by Hasan (2003).
Hasan (2003: 4) claims that IS development, in many cases, should be considered a valid research activity (and method) because, not only is knowledge created about the development process itself, but also because “a deeper understanding emerges about the organizational problem that the system is designed to solve”. Markus et al. (2002) put forward a similar case in arguing that IS development is a particular instance of an emergent knowledge process (EKP) and that this constitutes original research where requirements elicitation, design and implementation are original and generate new knowledge on how to proactively manage data and information in complex situations. Hasan (2003: 6) further contends that this often involves a staged approach, where “systems evolve through a series of prototypes” with results of each stage informing requirements for the next and subsequent iterations.
Nunamaker et al. (1991) take an approach consistent with the above but draw on an alternative research tradition in case studies and, in particular, action research. Again, using ‘replication’ strategies, each new instance (case or action research activity) builds upon and refines knowledge gleaned from previous studies (Yin, 1994). Nunamaker et al. (op cit.), go on to note that IS development is enabled by the uniqueness of the technology employed (which can, as a tool, mediate knowledge generation and the communication of same).
This feature has been studied extensively by scholars in ‘activity theory’. Notably, activity theorists emphasize the holistic nature of the IS development process and, in particular, the critical nature of the cultural and social context within which systems are developed (Nardi, 1996). The socio-technical view of IS, where hardware, software, people and processes are integrated into a complex, purposeful whole, is one of the key features that make information and communication technologies “like no other in the history of mankind” (Hasan, 2003: 4).
Thus, to summarize: the development of our DSS is a legitimate research activity in its own right, which draws on the more established, traditional research approaches of the design sciences and especially case study/action research. Each new application of the DSS (e.g. to a new destination) produces a new version of our prototype and extends our knowledge of the green tourism economy research domain. This is akin to employing a multi-case (study) research strategy - with each new case refining and extending results of previous iterations - and finally, many research findings and outputs are actually inherent in the various conceptual models (and implementations of these) that constitute the DSS.
5. System
Architecture
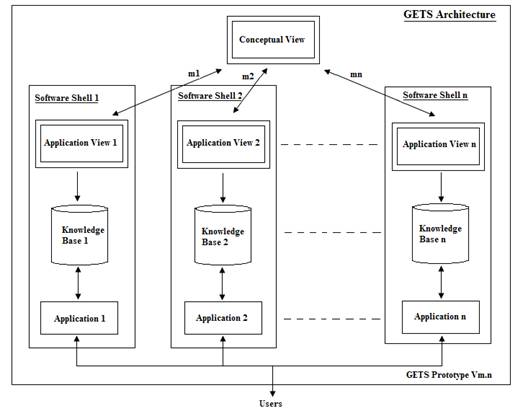
The key to managing complexity within GETS is the system architecture employed, a high-level view of which is presented in Figure 1. A fundamental objective of the GETS project is to produce a system that is iterative, scalable and open, Iterative (in this instance) means that each application (e.g. to a new destination or aspect of a destination) produces a new prototype that increases or refines our knowledge of the green economy domain; scalable means that the system must be able to cope equally effectively with large and small destinations; and open means that GETS must be capable of handling any type of data, irrespective of source or format.
Figure
1: GETS Architecture – High-Level View.
One of the keys to realizing both an
iterative and a scalable system is developing all code (and higher-order
applications) around abstracted data models.
Essentially, the aim is to allow new functionality to be added (e.g. as
issues associated with a new destination introduce new system requirements)
without having to revise existing applications.
The open systems objective is
realized by adopting a design for GETS consistent with ISO ‘3-Schema
Architecture’ principles (van Griethuysen, 1982). With this approach, the Conceptual View is a highly abstracted model of the total system,
completely free of any implementation-level detail. Application
View 1, ----, Application View n are external-level schemas developed for
individual applications, implemented within specific software shells (Software Shell 1, ----, Software Shell n). Examples of these (used in applications
implemented to date) are Excel™, Access™,
a rule-based expert systems shell called Flex™
and the system dynamics simulator, PowerSim™.
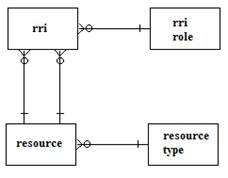
The conceptual model defines the objects of the ‘Universe of Discourse’, including rules governing allowable classifications, states, transitions and constraints (van Griethuysen, 1982). An illustration of part of the conceptual model is presented in Figure 2. The model is represented in entity-relationship form (Chen, 1976), it is highly abstracted and consists only of the core domain constructs, without any peripheral or presentation-level detail. The entity-relationship approach was employed largely because the principal motivation for Chen’s (op cit.) research was to produce a conceptual modelling approach that allows a unified view of data.
Figure
2: Conceptual Model (Partial).
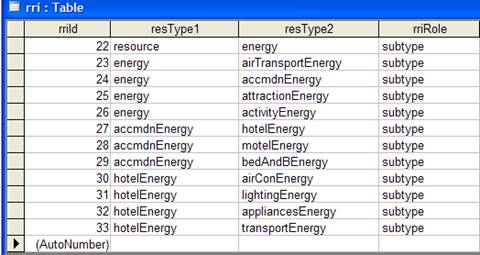
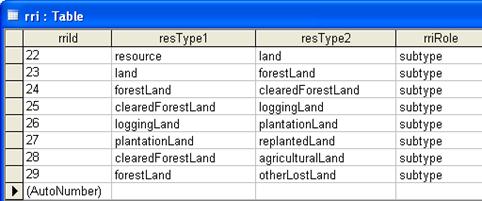
Implemented as a relational
database application, the intersecting entity, rri (resource-resource
involvement), would translate to something like the Access™ table presented in Figure 3. This table details some of the important
subtype relationships that need to be captured. In this case, energy is specified as a resource subtype, energy may be decomposed further into airTransportEnergy, accmdnEnergy, attractionEnergy and activityEnergy and these, in turn, may
be broken down even further (as illustrated in Figure 3).
Figure
3: Access Implementation Of rri Conceptual Model Relationship.
Representing the conceptual model in
an abstracted form produces a number of benefits, including: i) where
appropriate, common functionality may be coded around the abstracted view,
leading to a reduction in system development effort; ii) integration of DSS
applications, developed around external views, is facilitated because core data
types are all mapped back to the common conceptual view (model); iii) better
integration means that functionality may be more conveniently shared between
applications (which also means less coding effort); and iv) ongoing system
maintenance is reduced (again resulting in a reduction of total development
effort).
An external model or user view is a mapping from all or part of a conceptual model to a language or representational form of the user’s choosing (van Griethuysen, 1982). In addition, it must be possible to map in the reverse direction: i.e. from external to conceptual model. As noted, a number of key GETS functions are implemented as external components using SD and, specifically, the SD product Powersim™ (2003). We shall now illustrate the mapping process and provide an example of an external model/application through the example presented in Figure 4 below.

Figure
4: Energy Usage External Application Model (Partial).
Figure 4 is represented in
‘causal-loop diagram’ (CLD) form. For a
detailed introduction to CLDs, the reader is referred to Manni and Cavana
(2000) but, in their simplest form, only one modeling construct is employed; an
arrow connecting two domain variables, indicating a causal connection between
them. Arrows are generally annotated with either a ‘+’ or ‘-‘; a ‘+’ symbol
meaning that both variables move in the same direction (i.e. increase or
decrease together) and a ‘-‘ symbol meaning that the variables move in opposite
directions. Generally, when developing a
SD model though, the customary method is to firstly specify it in CLD form and
then to translate it to the more complex stock-flow form used by
commercial SD software products.
Within a green economy context,
a distinction needs to be made between traditional carbon-intensive energy (CIE) (oil, coal and natural gas) and renewable energy (RE) (hydro, wind,
biomass, waste etc.) sources. Obviously,
the total energy cost is dependent on
the respective CIE and RE costs. If the CIE
cost is high though, it is likely that more will be invested in RE research and this, in turn, should
increase the RE supply. If the RE supply is high the CIE demand may drop, thus placing less
pressure on CIE supply and, finally,
without this supply pressure, the CIE
cost should be less. This, of course, is the rough basis for the various
carbon pricing and taxing schemes being introduced in many countries throughout
the world (see e.g. Callan et al., 2009).
Part of the SD external application’s model dealing with this particular set of relationships is presented in Figure 5. Specifically, this is a Powersim™ model and a major reason for converting the CLD to this particular form is to take advantage of the package’s powerful simulation and scenario generation/evaluation capabilities.
.
Figure
5: Stock-Flow Representation Of Figure 3 CLD (Partial).
The basic building blocks of SD (stock-flow) models are stocks (represented as rectangles), flows (represented as arrows with circular flow regulators attached), converters (represented as circles) and constants (represented as diamonds). In our model, examples of stocks are RECost and CIEDemand. There is a level associated with each stock, which can be an actual value or a value bounded by some artificial scale. Stock levels vary with flows, which may be inflows, outflows or bidirectional. For example, CIEDVarn (CIE demand variation) is a bidirectional flow such that:
![]()
That is, in our model, the CIE demand level at time, t, is a function (f) of the CIE demand level at time, t-1, and its variation at time, t. These equations are the foundation of Powersim’s formidable simulation capabilities. Moreover, values of each model variable at each simulation time-step may be captured and stored as instances of yet another rri subtype, with the general form:
![]()
and this data may then be used in other external applications. An example is presented in the following section.
6 (Mini)
Case Study: A Green Growth Road Map For
The case study is concerned with a recent research/consultancy exercise
conducted by
Bali is an extremely popular tourism destination, and, on the surface, its future looks bright with, between 2011 and 2020: i) annual visitor numbers expected to increase from 7.1 to 14.4 million (Turner, 2011); ii) annual tourism GDP predicted to increase from $US2.95 billion to $US5.38 billion (Hoque, 2011); and iii) tourism-related employment demand forecast to increase from 1.1 million to 2.0 million (Hoque, 2011).
While the economic future looks extremely bright, the anticipated rapid growth is not, however, without its downside. The more significant potential problems and issues identified include traffic congestion, excessive and unsightly waste and pollution, inadequate roads and infrastructure and major environmental damage (Filep, 2011). Consequently, the green growth roadmap emphasized minimizing negative environmental impacts by attracting fewer tourists willing to pay more (i.e. increasing visitor yield).
This objective is encapsulated in the CLD presented in Figure 6, where (at the top of the diagram) it can be seen that an improvement in environment quality can reasonably be expected to result in an increase in visitor goodwill (Hawkins and Bohdanowicz, 2011) and this, in turn, should allow tourism operators to increase prices, resulting in both an increase in visitor yield and a drop in visitors.

Figure 6: Some Key Relationships In
Increasing Visitor Yield.
The roadmap identifies many environmental-improvement strategies, one of which is: “Based on the open space plan, establish more protected areas, having strong development controls and recognizing a minimum forest cover of 30%” (Lipman et al., 2011: 38). The (somewhat simplified) core of the external DSS application dealing with land use is illustrated in Figure 7. It shows that, over time, forest (and wilderness) land is claimed for agricultural and farming purposes and this land, in turn, may be converted into settlement land. Deforestation and settlement land increase rates determine the speeds at which these land conversions occur and a reforestation rate represents efforts to reclaim lost forests through replanting programs. Finally, some agricultural land is lost to desert forever (because of drought, over-harvesting, water stress, climate change etc.) and this is represented by the agricultural land – productive land losses transition.
Figure
7: Land Use External Application (Partial).
An initial, generic version of the application was implemented using data derived from (UNEP, 2010). This version simulates changes in global land categories between 2010 and 2050 and, under a ‘business-as-usual’ scenario, the simulation suggests that the total global forest area will drop from 3,940 million hectares (Mha) to 3,700Mha during this period. However, under a ‘green’ scenario’ (with the equivalent of 2% of global GDP invested in various green and climate change mitigation initiatives) total forest land is actually expected to increase to 4,500Mha.
This model was then customized for
There is probably a good chance that efforts to reverse the current very
high rate of forest losses in
First, however, the new application requires land area trend data generated by the SD application discussed above and the abstracted conceptual model provides the basic framework for this transfer. That is, the SD application simulation produces streams of trend data on variations of areas of each land category over time and these and these are all specific instances of the rri subtype with the timeChange involvement role introduced earlier.
A decision tree example, related to whether action to remedy predicted deforestation at some future time, t, is required is presented in Figure 8.
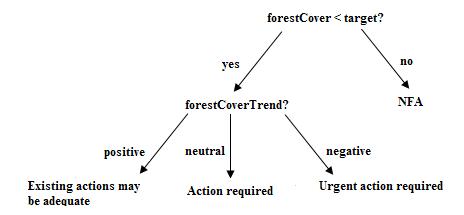
Figure
8: Decision Tree For Deforestation Mitigation Necessity Rules.
An example of a typical rule extracted from this representation is:

and the underlying Prolog code (utilizing rri data generated by the SD application) required to determine if the forest cover trend is negative is:

Digging a little deeper, inappropriate forest land use and allocation decisions are a major cause of current problems and, as an example, the WRI (1998) has reported that, in 75% of cases where forest land has been allocated for clearing and replanting, this has never taken place. This underpins one application rule which advises the user to explore ways in which dormant land in this category might be freed up for its original purpose (i.e. for use as an industrial timber plantation).
This is only possible after forest land has been classified consistent with the schema presented in Figure 9. This is a conceptual-level specification and, as such, outputs from this particular external application can be transmitted to further applications which might require this data. Thus, in this example, we have demonstrated how external applications may both generate data for, and utilize data from, other applications (developed using different software platforms) and that it is, primarily, the abstracted, conceptual data view that makes this possible.
Figure
9: Further rri Subtypes –
7. Conclusion
Green growth strategy development is a highly-complex process, demanding that a wide range and considerable volume of data be captured, structured and analysed. Furthermore, depending on the objectives of different aspects of policy development, certain information modelling and analysis methods may be more appropriate than others: i.e. a ‘horses for courses’ approach is required when developing specific decision support applications.
At the same time, whatever methods and software platforms are employed in developing various system components, the overall strategy development domain is so tightly integrated that some mechanism is required to allow information-sharing between applications. In our DSS, this is realized through the use of an abstracted conceptual model and a system design based on the ISO 3-schema architecture. Examples of data sharing between external applications developed using the rule-based expert systems and SD paradigms (approaches that, on the surface, appear to have little in common) were presented and discussed.
Finally, parallels between DSS development and case study research were emphasized: in particular, it was noted that each new external application added to the DSS extends our knowledge of the overall study domain in much the same way as new cases build upon and refine previous iterations in multi-case study research. Thus, the version of the DSS described in this paper, the result of an initial system specification and two subsequent field applications, represents the beginning, rather than the end, of this particular green growth tourism strategy research project.
8. References
BPS (2010). Bali Dalam Angka (Bali in
Figures) – 2010, Katalog BPS: 1102001.51, Badan Pusat Statistik,
Callan, T.,
Chen, P.P.S. (1976). ‘The Entity-Relationship Model: Towards a Unified View of Data’, ACM Transactions on Database Systems, Vol.1, No.1, pp. 9-36.
DeMarco, T. (1978). Structured
Analysis for System Specification, Yourdon Press,
Dijkstra, E. W. (1968). ‘Letters to the Editor: Go To Statement Considered Harmful’. Communications of the ACM, Vol.11, No.3, pp. 147–148.
Feldman, P. and Miller, D. (1986). ‘Entity Model Clustering: Structuring a data Model by Abstraction’, The Computer Journal, Vol.29, No.4, pp. 348-360.
Filep, S. (2011). Understanding
Visitors to Bali, Technical Report, Centre for Tourism and Services
Research,
Gossling, S. (2005). ‘Tourism’s Contribution to Global Environmental Change: Space, Energy, Disease and Water’, in (C.M. Hall and J. Higham eds.) Tourism, Recreation and Climate Change: International Perspectives, Channel View Publications, Clevedon.
Hamele, H. and Eckhardt, S. (2006). Environmental
Initiatives by European Tourism Businesses: Instruments, Indicators and
Practical Examples,
Hasan, H. (2003). ‘Information Systems Development as a Research Method’, Australasian Journal of Information Systems, Vol.11, No.1, pp. 4-13.
Hawkins, R. and Bohdanowicz, P. (2011). Responsible
Hospitality: Theory and Practice, Goodfellows,
Hoque, S. (2011). A Forecast of the
Impact of Tourism on GDP and Employment in Bali, Technical Report,
Law, A., DeLacy, T., McGrath, G.M. and Whitelaw, P.A. (2011). ‘Tourism
Destinations in the Emerging Green Economy: Towards Blending in Brilliantly’, Proceedings of the CAUTHE2011 National
Conference, 8-11 February,
Lipman, G., DeLacy, T., Buckley, G., Wiranatha, A., Suhandi, A. and Law, A. (2011). A Green Growth 2050 Roadmap for Bali Tourism, available through the authors at Centre for Tourism and Services Research, Victoria University, Melbourne, Australia.
Maani, K.E. and Cavana, R.Y. (2000). Systems Thinking and Modelling:
Understanding Change and Complexity, Prentice-Hall,
Markus, L., Majchrzak and Gasser, L. (2002). ‘A Design Theory for Systems that Support Emergent Knowledge Processes’, MIS Quarterly, Vol.26, No.3, pp.179-212.
Mueller, P., Cao, J.N. and Wang, C.L. (eds.) (2009). Scalable Information Systems (Revised Selected Papers from the 4th
International ICST Conference – INFOSCALE 2009), Springer,
Naidoo, R. and Adamowickz, W. (2005). ‘Biodiversity and Nature-Based Tourism
ay Forest Reserves in
Nardi, B.A. (ed.) (1996). Context and
Consciousness: Activity Theory and Human-Computer Interaction, MIT Press,
Nunamaker, J.F., Chen, M. and Purdin, T. (1991). ‘Systems Development in Information Systems Research’, Journal of Management Information Systems, Vol.7, No.3, pp. 89-106.
Pornphol, P. and McGrath, G.M. (2012). ‘Information Systems Development as an Emergent Knowledge Research Process’, International Journal of Interdisciplinary Social Sciences, Vol.6, No.1, pp. 301-318.
Powersim (2003). Powersim Studio 2003: Reference Manual, Powersim
Software AS,
Scott, D.,
Amelung, B., Becken, S., Ceron, J. P., Dubois, G. and Gössling, S. (2008). Climate Change and Tourism: Responding to
Global Challenges, World Tourism Organization (UNWTO), United Nations
Environment Programme (UNEP),
Turner, L. (2011). A Long-Term Visitor Forecast for Bali, Technical Report, Centre for Tourism and Services Research, Victoria University, Melbourne, Australia.
UNEP (2010). Green Economy Report, Towards a Green Economy: Pathways to Sustainable Development and Poverty Eradication, downloaded 23/12/2011 from : http://www.unep.org/greeneconomy/v2/GreenEconomyReport/tabid/29846/Default.aspx.
van Griethuysen, J.J. (1982).
‘Concepts and Terminology for the Conceptual Schema and the Information Base’, ISO Technical Report ISO/TC9/SC5/WG3,
ISO,
Vennix, J.A.M. (1996).
Walker, P.A., Greiner, R.,
McDonald, D. and Lyne, V. (1999). ‘The Tourism Futures Simulator: A Systems
Thinking Approach’, Environmental Modelling and Software, Vol.14, pp.
59-67.
WEF (2009). Towards a Low Carbon Travel and Tourism Sector, World Economic
Forum,
WRI (1998). World Resources Institute - World Resources 1998-99,
Yin, R.K. (1994). Case Study Research:
Design and Methods, Sage,
Contact the Authors:
G. Michael McGrath, School
of Management and Information Systems, Footscray Park Campus, PO Box 14428
Melbourne City, MC 8001 Australia; Tel: +61 3 9919 4627; Fax: +61 3 9919 5024;
Email: michael.mcgrath@vu.edu.au
Alexandra Law, Centre for Tourism and Services Research
(CTSR), Footscray Park Campus, 20 Geelong Road, Footscray, PO Box 14428
Melbourne, VIC, 8001; Tel: +61 3 9919 4928; Fax: +61 3 9919 5278; Email:
alexandra.law@vu.edu.au
Terry De Lacy,
Centre for Tourism and Services Research (CTSR), Footscray Park Campus, 20
Geelong Road, Footscray, PO Box 14428 Melbourne, VIC, 8001; Tel: +61 3 9919 5349 Fax: +61 3 9919 5278; Email:
terry.delacy@vu.edu.au