Dynamics Of Organizational KMS Implementation And Adoption
Poornima Panduranga Kundapur, Lewlyn L Raj Rodrigues, Manipal
University, Manipal, India
ABSTRACT:
The main aim of this research
article is to study the factors that influence the implementation and adoption
of a Knowledge Management System (KMS) using System Dynamics (SD).
Organizational knowledge in today’s ‘knowledge economy’ has a positive effect
on the sustainability, competitive advantage, innovation and effectiveness
especially in the case of knowledge intensive organizations like those in the
software sector. In this study, the influence of the quality constructs on
organizational KMS implementation is researched. The five-step SD research
methodology was followed to design and develop a ‘Knowledge Management Cause
and Effect Model’ (KCEM) simulation model. This model simulates and studies the
causal dependencies between the various quality factors and the usage of KMS by
the organizational employees or knowledge workers. Simulation experiments were
conducted to study the behavioural patterns among
knowledge workers as they integrate the new technology into their work pattern.
The system performance was observed by varying values of the variables under
study. Different scenarios were designed and the variables were adjusted to
compare the actual practices and model assumptions. The results were
significant. The study found that there
is a major influence of the organizational KM initiatives affecting knowledge
workers’ intent to use and share knowledge. An ideal environment where a
knowledge worker is provided all the possible KM enablers was found to
significantly improve knowledge sharing practices and the organizational
repository content. The findings also show that management support has a
positive influence on the service quality parameter of the model and service
quality has the same influence on KMS design quality and actual system use parameter.
Keywords: Knowledge worker, Knowledge management
system, System dynamics, KCEM
1.
Introduction
According to Davenport and Prusak (1998, p. 5) the working definition of knowledge is “knowledge is a fluid mix of framed experiences, values, contextual information and expert insight that provides a framework for evaluating and incorporating new experiences and information”. Rao (2005, p.3) on the other hand states that “an estimated 4.5% of available corporate knowledge is lost or hidden due to employee turnover, information mismanagement, and knowledge hoarding.”
Rao (2003, 2005) further adds that Information Technology (IT) firms rely fundamentally on their organizational knowledge base for their business processes. Therefore, Knowledge Management (KM) practices in such organizations have been aligned with their core business objectives to improve customer service standards, enhance project management parameters enabling them to maintain their market standing. The major challenge for the IT managers in such a setup, however, is to manage this ‘corporate knowledge’ in a scenario where excessive information overflow has been identified. These managers work on strategies to channelize the knowledge flow in order to benefit both the organization and the employees. Hence, one of the most important organizational IT strategies to build, leverage and create value for the knowledge base in an organization is the implementation of Knowledge Management Systems (KMS).
Knowledge management systems, thus, “are a special class of information
systems designed to facilitate KM, the leveraging of organizational knowledge
through knowledge creation, knowledge storage/retrieval, knowledge transfer,
and knowledge application” (Alavi and Leidner, 2001, p. 114). KMS usage has seen a high for the
purpose of integrating and sharing technology related data that is distributed
in the organization’s knowledge base, “with the expectation that information silos
are eliminated, all kinds of information resources are effectively integrated
and shared, and cross-boundary, cross-departmental and inter-level business
collaboration are achieved” (Liu and Li, 2009). Software companies too are
increasingly investing in KM systems in order to support knowledge and
information sharing. It was Peter Drucker who coined
the term knowledge workers (KW) to refer to employees of organizations using
knowledge-based systems to sustain the competitive edge (
Knowledge is said to be intangible and cannot be easily managed. Rao (2003) indicated leveraging knowledge in an organization is essential as it may also be recognised as the most important job the management must have. Hence, knowledge is being widely viewed in the present business scenario as a critical component that needs to be efficiently and effectively managed.
It may be interesting to note that organizations implement a KMS to seek
competitive advantages but meet with mixed results in terms of successful
implementation (Malhotra, 2001). This study
investigates and analyses the previous KMS related literature along with the
cause-effect model approach of system dynamics to identify those factors that
could have an influence on the adoption pattern among knowledge workers using
an organization’s KMS. It may be assumed that a number of factors play a vital
part in the actual level of utilisation of a KMS
implementation. Appropriate policies are therefore in demand to achieve a
sustained and effective adoption of an organization’s KMS. In the next section,
a theoretical background is presented, followed by the research method adopted
which illustrates the development of modelling and
the simulation design. The simulations are based on the actual operation of KMS
in software companies in
2.
The Background And Context
The literature review of KMS implementation reveals the necessity of establishing such systems for an organization to counter possible competitive threats in any industry. In order to survive the competitive threat, tremendous amount of effort, time and money has been invested to ensure success of such systems. The SD approach, alternatively, models and simulates the scenario and therefore was used to explore the influence of various factors on KMS and its successful implementation. The Sterman approach has been followed to arrive at the proposed model.
2.1.
Development Of The Theoretical Model
Jennex and Olfman (2004) designed the Jennex and Olfman KMS success (J&O) model as an adaptation of the well-accepted DeLone &McLean (D&O) model of IS success constructed by DeLone and McLean model in 2003. The basic dimensions of the J&O model are oriented towards to the KM setting rather than to the generic business concepts that the D&M model addressed. The six dimensions of interest that constitute the J&O model are described in the following sections.
2.1.1. The Quality Dimensions Of
The Model
Jennex and Olfman (2004; 2005) and Jennex (2006) designed the first sub-dimension of the System Quality dimension as the Technological Resources which involves the ability of an organization to design, develop, operate, and maintain a KMS. The second sub-dimension is Form of KMS, which has to do with the level to which the organizational knowledge and KM processes have been computerized and integrated. The next sub-dimension is Level of KMS, identifies how up-do-date is the KMS in terms of on-going current activities (Jennex and Olfman (2004, 2005).
The Knowledge/Information Quality dimension is explained by the concept of capturing the right knowledge to the right users at the right time. This dimension includes three sub-dimensions: The Knowledge Strategy/Process sub-dimension includes processes that identify the knowledge that needs to be captured and then reused. The second sub-dimension in Knowledge/Information Quality is Richness which “reflects the accuracy and timeliness of the stored knowledge as well as having sufficient knowledge context to make the knowledge useful” (2004, p.7; 2005, p.44). The third sub-dimension is Linkages that is used to “reflect the knowledge and topic maps and/ or listings of expertise available to the organization” Jennex and Olfman (2004, p.7; 2005, p.44).
The Service Quality dimension defined in the J&O model deals with those aspects of a KMS that ensure that the KMS has the requisite support for users to use the KMS effectively. The sub-dimension Management Support has to do with allocating the required resources, managerial encouragement and direction, as well as necessary control. The other sub-dimensions are User KM Service Quality and IS KM Service Quality, that involve “support from the user organization in how to use the KMS” and “support from the IS organization in KMS tools, maintenance of the knowledge base, maps of databases, and reliability and availability of the KMS” (Jennex and Olfman, 2004, p.7), respectively.
2.1.2.
The Intent To Use: Perceived Benefit Dimension
The Intent to Use/Perceived Benefit dimension measures the perceptions of the benefits of using a KMS. It tries to identify a knowledge workers’ intention to use and concerns prediction of future usage behaviour. According to the developers of the model, Jennex and Olfman, ‘use’ is associated with user satisfaction and hence they state that this dimension does not reflect use alone. This reasoning for intention to use in the J&O model is extended in theoretical terms by incorporating perceived benefit as that reflecting the social and job-related features of a KMS user’s expectations, which would have not otherwise been captured (Jennex and Olfman, 2004).
2.1.3. The Use/ User Satisfaction Dimension
The Use/User Satisfaction in the J&O model combines use of KMS and user satisfaction of a knowledge worker because Jennex and Olfman (2004, p. 7) saw “the two concepts as complementary notions in the KM implementation scenario.” They opined that when system use is optional and the system is usage does serve as a good indicator of success, however, user satisfaction may also be treated as a complementary indicator. They felt that User satisfaction would become a more useful indicator of success when system use is not optional.
2.1.4.
The Net Benefits Dimension
According to Jennex and Olfman (2003; 2004) a person’s performance in the workplace is influenced by that individuals’ use of the KMS. Subsequently the performance of the whole organization is affected by each individual impact. The association, they state, between individual and organizational impacts is often difficult to draw and is the reason for all impacts being combined into a single dimension. An important observation regarding this model is that the authors have recognized that the use of knowledge may have good or bad benefits. Further it allows for feedback from these benefits to drive the organization to either use more knowledge or to forget specific knowledge. This is where System dynamics models draw a similarity.
3.
The System Dynamics Approach
The SD approach allows modeling, describing, and understanding the behaviour of complex systems, so improving the capacity of individuals and organizations to learn and manage the knowledge related to these systems.
3.1.
Steps In System Dynamics
The research methodology adopted is in accordance to the modelling methodology as proposed by Sterman (2000). The steps as illustrated in the Figure 1 include:
3.1.1. Problem Articulation
The problem articulation is the initial and most important step of the system dynamics approach that involves defining the problem. In this paper, the problem identified is “To identify the factors that affect the quality constructs in KMS and to establish a relationship between the factors and the behavioural pattern”. This is in agreement with Sterman’s (2000, p. 99) statement that “a problem should never model a system, because the problem determines which factors are important to include and which to exclude and therefore be used to find the relevant system boundaries of the problem.” A reference mode or the hypothesized behaviour of the problem and the time horizon of interest must be identified in this stage (Sterman, 2000; Vogstad, 2004; Kundapur and Rodrigues, 2012).
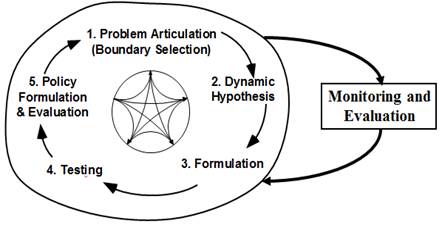
Figure
1: The System Dynamics Approach (Sterman, 2000)
3.1.2. Dynamic Hypothesis
This is the second step in the system dynamics modelling process. Once the problem has been articulated and the initial characterization is done, it is necessary to develop a theory about the problem. This theory or hypothesis is called the dynamic hypothesis. The hypothesis is said to be ‘dynamic’ because it characterizes the dynamics involved in the system to be modelled over the given time horizon. At this point, feedback mechanisms and the delays involved in the system are taken into account.
3.1.3. Formulation Of A Simulation Model
The next step in the System dynamics methodology for modelling is to move from the conceptual realm of diagrams to a fully specified formal model, complete with equations, parameters and initial conditions that can be simulated via computerised software (Sterman, 2000; Kundapur and Rodrigues, 2012).
3.1.4. Testing
Of The Model
Sterman (2000) explains that testing stage starts as soon as the first equation has been formulated. Testing partly involves comparing the simulated behaviour of the system under study with the actual behaviour. It also involves something more where each equation is checked. Whether each variable under consideration has a meaningful concept in real time is also verified. Parameter sensitivity checks are useful to decide how much effort should be dedicated to increasing the precision of the parameters.
3.1.5. Policy Design And Evaluation
Vogstad (2004) states that when the structure and behaviour of the model has been finalised and the modeller has sufficient confidence in the simulated model then the next stage would be to design and evaluate policies for the organization.
3.2.
Purpose Of System Dynamics Model
The study undertaken is fundamentally structured on the J&O model but
strictly adheres to Sterman’s principles. The
principle of system dynamics, he asserts is to always model a problem with a
purpose that has to be clearly defined. The system must not be modelled (Sterman, 2000). Hence
the purpose of this model is focussed on primarily
learning and understanding the dynamic system behaviour
of a KMS and its users in the Indian software sector and to make policy
recommendations.
3.3. Target Audience
The study will definitely benefit policy decision makers and KM practitioners in software organizations on direction of growth of KMS in the organization. KM researches may also look into the model and discover dynamic structures not identified based on specific situation mapping.
3.4.
Mapping System Structure: Endogenous, Exogenous and Extraneous variables
The model boundary chart of System dynamics is used to visualize the system boundary and identify those variables that are endogenous, exogenous and extraneous. The variables used in this model are summarized in Table l.
Table
1: Model Boundary Chart For KCEM Model
|
Endogenous |
Exogenous |
Extraneous |
|
Service Quality, System Quality, Information/ Knowledge
Quality, Net benefits, Operational Knowledge base, Knowledge, Actual
Knowledge workers, Total Knowledge workers’ satisfaction, Expected KMS design
quality, Management Support on KMS, Perceived Ease of Use, Perceived
Usefulness, Behavioral Change in using KMS, Cognitive Change in using KMS,
Intent to Use, Actual Use rate, Expected Use rate, Knowledge growth rate,
Increase in KW expectation, Performance Ratio, Building knowledge,
Disseminating knowledge, Building Knowledge worker satisfaction, Dissipating
Knowledge worker satisfaction, Adoptions, Obsolescence |
Knowledge
worker Feedback for system development, Perceived sufficiency of
Organizational resources, Effort on Knowledge worker training, Expected
growth rate, WOM multiplier, approach 1, approach 2, approach 3 |
IS investment, Expected IS investment, Perceived necessity to invest
in KMS |
All the variables defined in the model fall inside the defined boundary of
the model and serve the purpose specified (Table 1).
While developing the “Knowledge Management Cause and Effect Model” (KCEM), those endogenous variables that illustrate the actual KMS implementation in any organization, were included. The variables “Knowledge worker satisfaction” and “Building Knowledge worker satisfaction”, considered as endogenous variables, are incorporated in the model to understand the relationship between the KMS implementation setting and the rate of adoption of the KMS.
Nonetheless, the exogenous variables listed in Table 1 having a part to play in the adoption and implementation patterns of a KMS cannot be overlooked. A ‘Knowledge worker feedback for system development’, for example, does have an impact on the knowledge workers’ perception of how much difference the KMS makes in their routine tasks. Thus subsequently leads to better performance by the knowledge worker.
The three exogenous variables that were identified from the available KMS literature were ‘Expected IS investment’, ‘Perceived necessity to invest in KM’ and ‘IS investment’. These were included in the model to give the model the required real-time adjustments in order to study the behaviour of the system. The KCEM model can be further expanded in terms of the complexity of policy-making implications by identifying more key exogenous variables in the future.
3.5.
Model Structure
The SD model ‘Knowledge Management Cause and Effect Model’ (KCEM) has been designed and developed based on the abovementioned theoretical background, literature review and previous discussions of KMS implementations during the course of this study.
3.5.1. Construction Of The
Model
The KCEM model is adapted from a model by Wang and Liu, 2005. The components
of the KCEM were developed with respect to the J&O model (Jennex and Olfman, 2004). The
stocks designed are Actual knowledge workers, Operational Knowledge Base, Total
knowledge workers’ satisfaction. The stocks that were renamed to suit the
purpose of this study were Net Benefits and Knowledge. The model developed is a
representation of the KMS setting in Indian software scenario for
implementation of J&O model.
The model has been designed and developed based on the generic basic diffusion model incorporated into the KMS scenario of an organization (Sterman, 2000; Ranganath and Rodrigues, 2008; Kundapur and Rodrigues, 2012). A knowledge worker’s cycle of growth starts from a being a new employee with no experience in using a KMS to a trainee employee (undergoing training to use a KMS) to a new knowledge worker (trained and ready to apply his skills in using a knowledge repository like a KMS) to an experienced knowledge worker with years of experience in handling and applying KMS knowledge all treated as stock variables in the model. Causal loop diagrams are powerful tools to map feedback structure of complex systems but they are limited by their inability to show stocks and flows. Hence we have used stock and flow diagrams to simulate the knowledge worker behavioural pattern.
3.5.2. Stock And Flow Diagram
A knowledge worker in any organization utilizes the KMS to capture contextual knowledge applicable to his/her area of work. A knowledge worker‘s competence depends on how much he understands his work profile along with the information or knowledge seeking attitude possessed by him (Ranganath and Rodrigues, 2008). This is however made possible only if the KMS existing in the organization provides access to all the available knowledge to the knowledge worker.
3.5.2.1. Stocks And Flows
According to Sterman (2000), in the system dynamics approach ‘causal loop diagrams’ are more suited to represent interdependencies and feedback processes. There however is a drawback of using this tool which is that it has nothing much to work with in terms of capturing stock and flow structure of the system under study. Stocks and flows are, thus, an essential concept in system dynamics theory.
3.5.2.2. Identifying Stocks
The stock and flow diagram of the proposed model is presented in Figures 2 to 4. This paper identified seven stocks for the model and they are:
Ø Actual knowledge workers: Indicates stock of actual number of users of KMS
Ø
Actual
System use: Indicates stock of actual KMS usage
Ø
Net
Benefits: Indicates stock of net benefits for a KMS user
Ø
Knowledge
worker satisfaction: Indicates stock of user satisfaction when using KMS
Ø
Operational
Knowledge Base: Indicates stock of organizational knowledge stored/archived
Ø
Knowledge:
Indicates stock of knowledge created/growth
Ø
Net
investment: Indicates stock of investment by management on KMS
3.5.2.3. The Basic Adoption Process
The model assumes all categories of knowledge workers whether they are new employees, trainees or experienced work in the same organization (Kundapur and Rodrigues, 2012). The model stocks the pool of actual knowledge workers or KWs interacting with other employees. KWs not only accumulate but also are lost per quarter. To indicate this increase in the actual KW stock, the word-of mouth (WOM) multiplier variable is used (Figure 2). Similarly, the number of KWs lost is also determined as being a fraction of the current knowledge worker base. The higher the average knowledge worker satisfaction, the greater the WOM multiplier will be and the less the loss fraction will be. In other words, the more the average satisfaction goes up, the more KWs per current KW, there will be a smaller fraction of KW loss.
Another variable ‘Total Knowledge worker’s Satisfaction score’ can be both built and dissipate. The ‘Knowledge worker satisfaction dissipating fraction’ variable is used to determine how much satisfaction has dissipated. The fraction to set at 0.05 meaning nearly 5% of the total satisfaction score will dissipate each quarter. Each KW interaction increases the opportunity to build total satisfaction and hence another variable is created to indicate how much satisfaction is built for each interaction. In this model, another stock ‘Operational Knowledge Base’ is also created to determine building of knowledge and the dissemination of the knowledge base. To build the knowledge base, three approaches have been included like monetary benefits, rewards, being involved in deploying the organization’s strategy.
Figure
2: The Basic Adoption Process
4.
Management Support
Figure 3 highlights the influence of management support on KMS that will in turn influence the ‘performance ratio’ of a knowledge worker.
Figure
3: Effect Of Management Support
5.
The Quality Dimensions
The three quality dimensions ‘Service’, ‘System’ and ‘Information’ quality dimensions have been included in another sector of the model and these three dimensions affect the ‘Overall KMS design quality’ factor. There are three constants that determine the effect of these quality dimensions on the overall design of the KMS and they are ‘Service q normal’, ‘Information q normal’ and ‘System q normal’. The model for the quality dimensions is presented in Figure 4.
Figure
4: Service, Knowledge/Information And System Quality
Dimensions
6.
Governing Equations
The causal relations between the variables of the model are linked in the form of equations for quantifying the simulation results. The units of variables are indicated in parentheses. A few equations have been listed below:
Actual Knowledge workers = INTEG (adoptions-obsolescence, 100) Units: person
Actual system use rate = INTEG (Net increase in system use, System use rate normal) Units: hour/(person*month)
Adoptions = Actual Knowledge workers*wom multiplier*adoption normal Units: Dmnl*person/month
average satisfaction per knowledge worker = Total Knowledge workers' Satisfaction score / Actual Knowledge workers Units: Dmnl/person
building knowledge = (approach 1*0+approach 2*3+approach 3*5)*Effect of user training on building knowledge Units: Dmnl
Building knowledge worker satisfaction = KMS interactions *satisfaction built per KMS interaction Units:Dmnl/month
KMS design quality normal = 0.3 Units: Dmnl
KMS interactions = Actual Knowledge workers Units: person
Knowledge= INTEG (Knowledge growth rate,Knowledge growth rate normal) Units: Unit/month
knowledge dissemination fraction = 0.05 Units: Dmnl/month
Knowledge growth rate = (Indicated knowledge growth rate-Knowledge)/Time to change growth rate Units: Unit/(month*month)
knowledge worker satisfaction dissipating fraction = 0.05 Units: 1/month
Knowledge worker satisfaction normal = 0.3 Units: Dmnl
Management support on KMS = Efct of performance ratio on management support * management support normal Units: Dmnl
Obsolescence = Actual Knowledge workers*actual knowledge worker obsolescence fraction Units: Dmnl*person/month
Operational Knowledge Base = INTEG (building knowledge - disseminating knowledge,50) Units: Dmnl*month
Total Knowledge workers' Satisfaction score = INTEG (building knowledge worker satisfaction- dissipating knowledge worker satisfaction, 50*Actual Knowledge workers*KW score normal) Units: Dmnl
wom multiplier = WITH LOOKUP (average satisfaction per knowledge worker,([(0,0)-(100,10)],(0,0),(10,0.012),(20,0.026),(30,0.042),(40,0.066),(50,0.1),(60,0.134),(70,0.176), (80,0.216),(90,0.27),(100,0.35) )) Units: Dmnl
7.
Results And Discussions
7.1. Time Horizon
System dynamics may be used as a prediction tool, and helps understand the problem being studied as well as potential decisions that may be considered. Hence the modeller must be able to design for a particular purpose outside a narrow time zone. In this case the trend of technology life span averages around 10 to 15 years, therefore the study maintains a 10 year time horizon (Wang and Liu, 2005, Liu et al., 2005).
7.2.
Reference Modes
The reference modes may be graphical or verbal representation of a social process or a problem of interest or may be based on a modeller’s intuitive knowledge in the proposed model dynamics. In this paper, the reference modes do not include historical data but is based on literature review and secondary data collected.
7.3. Modeling And Simulations
The following section explains the various simulation experiments conducted and the results established thereafter.
Scenario 1: Influence Of “No Attempts Approach To Build Knowledge”
In this scenario, the behaviour of the system is experimented by adjusting the value of ‘approach 1’ while keeping all other variables constant. The summary of the results obtained is displayed in Figure 5. When no attempts are made by the organization to enable knowledge sharing behaviour, it is observed that the number of actual knowledge workers exhibits an initial surge which later decreases and reaches saturation. The inference from this could be that initially there is the inherent curiosity of any worker about a new system introduced however over time, there is a decline in the interest levels and that is observed in the behaviour.
A similar trend is observed in the Total knowledge workers’ satisfaction
score. Users working on a KMS in the beginning tend to be highly influenced
however as time progresses, the satisfaction levels are much lower. A
significant influence is seen in the behaviour of
service quality parameter initially when there is oscillatory trend but later
drops down and stabilizes as is the case with Actual system usage. The
inference from this may be that an organization would need to provide some
means to knowledge workers to work on their intent to use the KMS. Reward
systems or measures are influencing factors on knowledge workers.
Figure
5: Influence Of No Attempts Approach
Scenario 2: Influence Of “Large Attempts Approach To Build Knowledge”
This scenario deals with a situation
where there is a concerted effort to help users adopt KMS and knowledge sharing
by providing the right inputs, say organizational culture promotes knowledge
sharing, education of knowledge workers on benefits of using system, providing
the necessary IT facilities and reward systems. In such cases, the results are
quite interesting with the number of actual knowledge workers showing growth
and saturation as is the case with knowledge workers’ satisfaction levels. The
influence of approach 3 is seen in the behaviour of
the three parameters: Actual system use, service quality and net benefits. There is an S-shaped growth pattern that signifies a
positive influence of approach 3 on these parameters. The results are shown in
Figure 6.
Figure
6: Influence Of Large Attempts Approach
Scenario
3: Highly Encouraging Management On Service Quality
In any organization, management support plays an all important role in influencing trends of adoption of new measures or technologies. It is assumed that more the management support, the more will be the employees are motivated. This was the experimental assumption for scenario 3 and Figure 7 displays the behaviour of management support on service quality dimension. It is observed that the assumption holds true here, the more the management support the better is the service quality.
Figure
7: Effect Of Management Support On Service Quality
Scenario
4: Service Quality On Expected KMS Design Quality
The effect of service quality on expected KMS design quality is being determined here in this modelling condition and the behaviour observed is that higher the service quality, the better is the system design and the lower is the service quality, there is an overshoot and collapse in the expected KMS design quality as shown in Figure 8.
Figure
8: Effect Of Service Quality On Expected KMS Design
Quality
Scenario 5: Service Quality On Actual System Use
Figure 9 displays a behavioural pattern that is an important of this study which is the impact of service quality on Actual system use. The effect of an increase in service quality shows a sharp increase in the actual system use and this is a significant result implying better service quality has a positive influence on the Actual system use.
Figure
9: Effect Of Service Quality On The Actual System Use
Scenario
6: Knowledge Worker Satisfaction
The success of implementation of any technology depends on the system use and the employee satisfaction score, hence the need to study the knowledge worker satisfaction levels in the three conditions explained earlier. When approach 1 is adjusted, there is no influence on knowledge worker satisfaction. However approaches 2 and 3 show an improvement over a period in the satisfaction levels, but among the two approaches, there seems to be no significant difference, implying that satisfaction level is not influenced differently either by approach 2 or 3. Figure 10 illustrates the same.
Figure
10: Knowledge Worker Satisfaction Score
Scenario
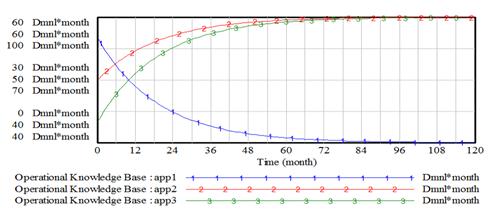
7: Operational Knowledge Base
The importance of KMS in an organization depends on the existing operational knowledge base or repository. If the knowledge repository is not significantly large and does not have enough content to serve the needs of a knowledge worker, then the KMS does not serve any purpose. This aspect was experimented varying the approaches. When approach 1 is adjusted, there is a negative influence on knowledge base.
However approaches 2 and 3 show marked improvements over the time period in the operational knowledge base levels, but among the two approaches, even when sufficient facilities are provided, there is a slow goal seeking pattern with a slightly better response to approach 2, implying that approach 2 influences operational knowledge base more than approach 3. However after 72 months, there is no difference between the two approaches. Figure 11 presents the operational knowledge base scenario.
Figure
11: Operational Knowledge Base
8. Conclusions
A system dynamics model for identifying the factors influencing the quality dimensions of J&O KMS success model has been designed in this study. The system dynamics approach used in the study facilitated the modelling of a KMS implementation model named ‘KCEM’. Additionally, the complex dynamic structure and the interactions between the key parameters of the model were studied. The system performance was observed by varying values of various variables under study. Seven scenarios were designed and the variables were adjusted to compare the actual practices and model assumptions. The results were significant. The study found that there is a major influence of organizational KM initiatives that affect knowledge workers’ intent to use and share knowledge in the organization. An ideal environment where a knowledge worker is provided all the possible KM enablers significantly improves knowledge sharing practices and repository content. The findings also show that better management support has a positive influence of service quality parameter of the model. The modelling process employed is iterative and results of any step can yield insights that lead to revisions in any of the earlier steps.
9. References
Alavi, M. and Leidner,
D.E. (2001).
“Review: Knowledge management and knowledge management
systems: Conceptual foundations and research issues,” MIS Quarterly, vol. 25,
no. 1, pp. 107-136.
Clark,
D. R. (2004). The Art and Science of
Leadership. Available [Online] at
http://www.nwlink.com/~donclark/history_knowledge/drucker.html. [Accessed on Aug 1, 2011].
Jennex, M. E. (2006). “Knowledge Management System Success Factors”, Encyclopaedia
of Knowledge Management, pp. 436-441, 2006.
Jennex, M. E. and Olfman,
L. (2003).
“A knowledge management success model: An extension of DeLone
and McLean's IS success model,” Ninth Americas Conference on Information
Systems,
Jennex, M. E. and Olfman,
L. (2004). “Assessing Knowledge Management Success /
Effectiveness Models,” Proceedings of the 37th
Jennex, M. E. and Olfman,
L. (2005). “Assessing Knowledge Management Success”,
International Journal of Knowledge Management, 1(2), 33-49, April-June 2005.
Kundapur, P. P. and Rodrigues,
L.L.R. (2012), “Simulating Knowledge Worker Adoption Rate of KMS: An
Organizational Perspective”, International Journal of Innovation, Management
and Technology, Vol. 3, No. 4, August 2012.
Liu,
S., Olfman, L. and Ryan, T. (2005). “Knowledge Management System
Success: Empirical Assessment of a Theoretical Model”, International Journal of
Knowledge Management, 1(2), pp. 68-87, April- June 2005.
Liu,
Y. and Li, H. (2009). “Applying
enterprise architecture in china e-government: A case of implementing
government-led credit information system of Yiwu”,
Proceedings of International Conference on e-Business,
Malhotra, Y. (2001). Organizational
Controls as Enablers and Constraints in Successful Knowledge Management Systems
Implementation. In Y. Malhotra (Ed.), Knowledge Management
and Business Model Innovation.
Ranganath, B. J. and Rodrigues,
L. L. R. (2008). ‘System dynamics: Theory and case studies”, I.
K. International,
Rao. M. (2003). Leading with Knowledge:
Knowledge Management Practices in Global Infotech
Companies, Tata McGraw Hill,
Rao, M. (2005). Knowledge Tools and Techniques: Practitioners and Experts
Evaluate KM Solutions, Elsevier Inc.,
Sterman, J. D. (2000). Business
Dynamics: Systems Thinking and Modelling for a
Complex World. Irwin McGraw-Hill, 2000.
Vogstad, K. O. (2004). “A system
dynamics analysis of the Nordic electricity market: The transition from fossil
fuelled toward a renewable supply within a liberalised
electricity market,” PhD thesis Norwegian University of Science and Technology
Faculty of Information science, Technology, Mathematics and Electrical
Engineering Department of Electrical Power Engineering, December 2004 NTNU,
ISBN 82-471 6890-1 (elektronisk) ISBN 82-471 6892-8 (trykt).
Wang,
W. T. and Liu, C. Y. (2005). “The Application of the Technology
Acceptance Model: A New Way to Evaluate Information System Success”,
Proceedings of the 23rd International Conference of the System
Dynamics Society.
Contact the Authors:
Poornima Panduranga Kundapur,
Manipal Institute of Technology,
Dr. Lewlyn L Raj Rodrigues, Manipal Institute of
Technology,