System Dynamics Of
Human Resource And Knowledge Management
In Engineering
Education
Lewlyn L. R. Rodrigues, Morvin Savio Martis,
Manipal Institute of Technology
ABSTRACT:
This paper simulates a time-based
dynamic model to fill the competence gap of engineering graduates, based on the
governing system variables. System dynamics is employed to illustrate relations
between graduation, recruitment, knowledge transfer, and knowledge loss rates
in causal form. Graphs are plotted to estimate the actual competence pool of
engineers, competence training completion rate and actual level of competence
absorbed, under the dynamic conditions of the governing time-based policy
parameters. Through the simulation results thus obtained, suggestions are made
for effective control of policy parameters of HR & KM system
1. Introduction
There has been a
proliferation in higher education in general, and engineering education in
particular, as it has a direct bearing on the economy of the country. But
maintaining a balance between supply and demand is always a challenging task.
Unless the engineering institutes produce engineers who are employable in the
market or be entrepreneurs, these large number of engineering institutes will
be mere unemployment producing centres.
Human resource planning has
always been a challenging task at the micro or macro levels in a country.
Time-based dynamic analysis would be of great help in strategic human resource
planning. At the same time, the transition from industrial economy to knowledge
based economy, has necessitated an efficient knowledge management (KM) at the
national level. Hence, the time is now ripe to dynamically analyse human
resource management (HRM) and KM through the development of an integrated
model.
ISO implementation in
service industries has brought the term ‘core competence’ into the doorsteps of
engineering institutes. Baker et al (1997), define ‘competence’ as the set of
skills and knowledge that an individual needs in order to effectively perform a
specified job. In engineering educational context, core competence to be
possessed by the future engineers would be the knowledge, skill and attitude to
be employable in the market or turn-out to be entrepreneurs. Despite the fact
that this core competence has to be developed during the four year period of
graduation studies, some may take less time (be employed during the third year
itself through campus placements) or some may take more time than four years.
This doesn’t rule out the possibility of rejection of the course by the
students during the study, or take up higher studies after the graduation.
System dynamics could be of
a powerful tool in competence pool mapping for varying values of competence gap
recovery time (Tr), competence loss rate averaging time (Ta),
competence training delay time (Tdt) and recruitment delay time (Tdr).
The term ‘competence’ used in the engineering educational context includes-
knowledge, skill and attitudes of the engineers/future engineers that would
enable them to be employed in the global market, join for higher studies, or
become entrepreneurs. Competence loss refers to the failure of the students to
be employable, pursue higher studies or become entrepreneurs.
The various specialized
nomenclature used in this paper are defined in Appendix 1.
2. Objectives
Of The Study
This paper has the
following objectives:
·
Develop
causal loop diagram for KM of an engineering education system.
·
Develop
the flow diagram of competence pool model (COPM) based on the above causal loop
diagram.
·
Derive
the governing equation of COPM based on which the system dynamics block diagram
of COPM is developed.
·
Simulate
the 3-dimensional graphs and generate the performance index table for the
dynamics of KM & HRM.
The model thus developed
would give the conditions for optimum performance of KM & HRM initiatives,
thus contributing to the policy scenario building and improvement on a
continual basis.
3. Literature
Review
Engineering institutions
are basically the knowledge repositories which exist to impart the required
level of competence in the future engineers by imparting the underpinning
knowledge, skills, attitudes, values, ethics and all other characteristics
demanded by the engineering profession. Hence, the institutes should be
equipped to transfer both ‘explicit’ and ‘tacit’ knowledge (Nonaka &
Takeuchi, 1995; Routledge, 2000) to the future engineers through the well
planned and organized curriculum.
Human Resource Management
(HRM) mainly involves planning, which involves five stages viz., analysis of
the system, deciding the time horizon of the plan, forecasting the demand for
and supply of manpower, reconciliation, and preparation of action plans
(Tripathi, 2002). So, the study of the system forms the very first phase of the
HRM. This issue is of national significance as the economy of the country is
now tied to the database of the knowledge workers in this knowledge based
economy.
Defining
KM is not only problematic but also varies from person to person based on the
context and use (Neef, 1999, Bhatt; 2001, Raub & Rulling 2001). Turban
& Aronson (2002), describe KM as a process that helps organisations
identify, select, organize, disseminate, and transfer important information and
expertise that are part of the organisational memory that typically resides
within the organisation in an unstructured manner. We select only this
definition as it is most appropriate in the context of this paper.
System Dynamics (SD) is
basically built upon traditional management of social system, cybernetics and
computer simulation (Sushil, 1993). SD
is based on the philosophy that the behaviour of a system is principally caused
by its structure based on policies & traditions; and the structure of an
organization can be best represented in terms of underlying flows of various
resources cutting across the functional departments tracing across various
feedback loops, delays and amplifications in the system. Hence, a SD model
typically consists of ‘causal loop’ and ‘flow diagram’. The causal loop depicts
causal hypothesis during model development, so as to make the presentation of
the structure in an aggregate form, whereas, flow diagrams represent the
detailed flow structure of the system in terms of the fine policy structures so
as to facilitate the development of the mathematical model for simulation
(Coyle, 1977).
4. Research
Methodology
 The research methodology is based on
the SD methodology proposed by Forrester (1961) and is depicted in Figure 1.
The research methodology is based on
the SD methodology proposed by Forrester (1961) and is depicted in Figure 1.
Fig. 1: Research Methodology
To start
with, we performed the situation analysis, which included problem
identification i.e. KM & HRM dynamics in engineering education and the
study of the number of engineers produced in the country per year and their
absorption rate. We then developed the causal loop diagram for KM & HRM
(Figure 2). Jay Forrester (1961) did the pioneering work of system dynamic
theory. Senge (1994) has used this theory very widely in developing the concept
of Learning Organisation. Through the reference of these two, we developed the
causal loop diagram (Figure 2). This considered the parameters which have
significant influence on knowledge, skill and attitude development that
provides the required level of competency to the engineers. We also considered,
absorption of these engineers based the competency thus gained. A sustainable
development of engineering competence has been the focus in the development of
causal relations, as engineers who fail to develop the required level of
competency to be absorbed in the market add to ‘competence loss’, which is in
turn detrimental to the growth of the country. Various influences are
represented in the form of feed-forward and feedback loops. A computer
simulation of this model is possible but is of limited use as the individual parameters
change (e.g. recruiting rate) cannot be isolated easily (Hafeez &
Abdelmeguid, 2003).
The next stage was to
develop the Flow Diagram (Figure3). This mainly illustrates the feedback (based
on competence gap) and feed-forward control (based on forecast competence loss
rate). In order to analyse the dynamic response we have taken time-based policy
variables Ta, Tr , Tdt and Tdr as indicated in the flow diagram.
During the
ideal operation, the number of graduates produced equals the number of
graduates absorbed in the market. But the problems arise when all the admitted
graduates fail to acquire the required level of competence, and also, the
market requirement for the skilled engineering graduates change due to several
other governing factors, as a result of which, the recruitment may also be
denied/delayed. So the above four policy parameters (Ta, Tr,
Tdt, & Tdr) are to be varied to determine their
optimum setting using simulation results. The influence of these parameters on
the Competence Pool, Competence Training and Absorption Rate would provide
useful input for policy makers.
Figure 3: Flow Diagram of
COPM
The governing equations
giving discrete-time feed-forward and feedback difference equations used to
calculate the system parameters are given in Appendix 1. The block diagram
representation of the COPM is shown in Figure 4. We have used MATLAB Version
6.5 software to produce the simulation.
The purpose of the entire
system is to match the desired level of competence pool required with the
actual level of competence pool absorbed. To achieve the desired level of
competence pool, a simple appropriate policy is proportional control, where
information containing the magnitude of the level (in the present case the
competence pool) is fed back to control the competence training rate (Hafeez
& Abdelmeguid, 2003). The competence training rate may be calculated by
dividing the discrepancy between the desired and actual value of the level by a
time factor, which represents the average delay in performing the training rate
(Appendix 1).
The policy parameters Ta,
Tr, Tdt and Tdr are varied to determine their
optimum settings using the simulation results. Once the initial conditions are
set the system automatically simulates results for reaching the desired
competence pool. We have taken the desired level of skill pool to be 250,000
engineers out of whom nearly one fourth i.e. 62,500 are unemployed which is
considered as the competence loss (Sheshagiri, 2004). We have taken a delay
time in training of 6 months to enable them to get the required competence
level through training. We consider a drop out of about 5% of engineers, which
includes the candidates leaving the course for all possible reasons. Therefore,
the simulation model is subjected to some 20% increase in the present
competence as shown in Figures 5a & 5b respectively.
5. Results
& Findings
The simulation results are
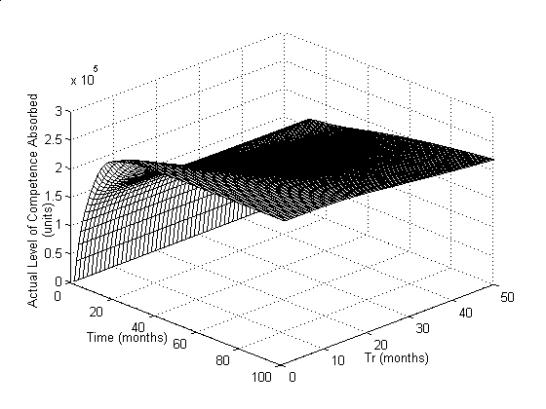
shown in the Figure 5 – 8. The Figures 5a, 5b, 5c shows the response of Actual
Engineers Competence Pool Level, Competence Training Completion Rate and Actual
Level of Competence Absorbed for a range of Tr values.
Figure 5a: Step response of
COPM for varying values of Tr
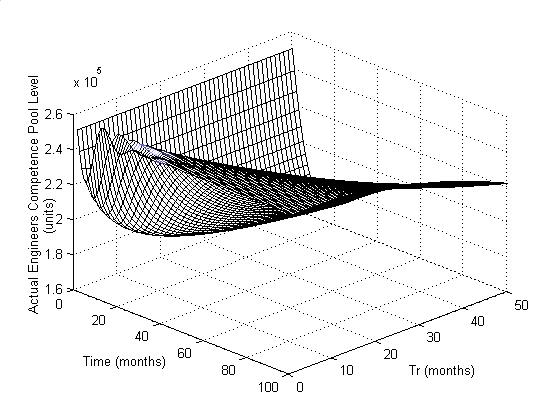
Figure 5b: Step response of
COPM for varying values of Tr
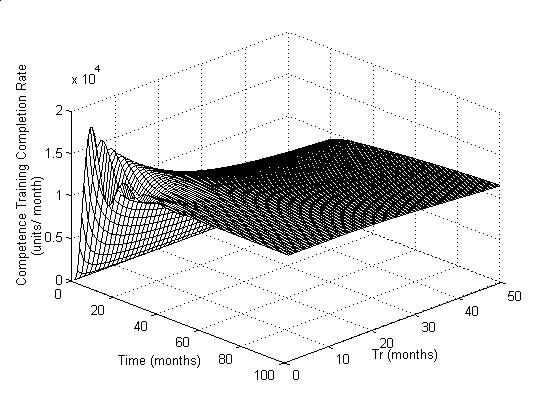
Figure 5c: Step response of
COPM for varying values of Tr
In the worst case (Figure 5a);
the system would take 80 months to recover the competence loss if Tr
is more than about 30 months. On the other hand, a small value of Tr would
allow a quick competency recovery (about 5 months). But if Tr is
fixed to be very small, unwanted oscillation in the competence skill pool may
result for a long period (about 35 months). Hence, we can conclude that Tr
has a higher influence on the system than the other policy parameters.
Moreover, as per control theory this constitutes a bad system, as number of
oscillations are supposed to be as minimum as possible.
The Figures 6a, 6b and 6c
illustrate the influence of Ta (Competence gap loss rate forecast
averaging time) to control the HR and KM policy.
Figure 6a: Step response of
COPM for varying values of Ta
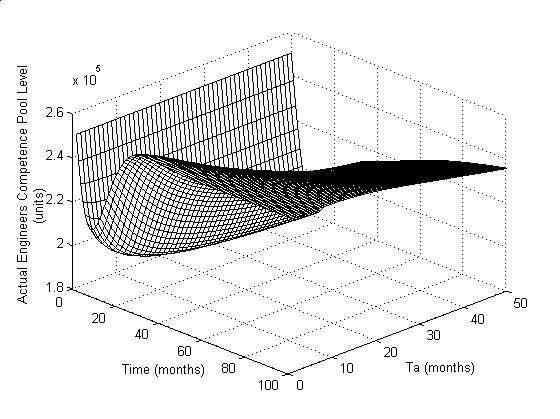
Figure 6b: Step response of
COPM for varying values of Ta
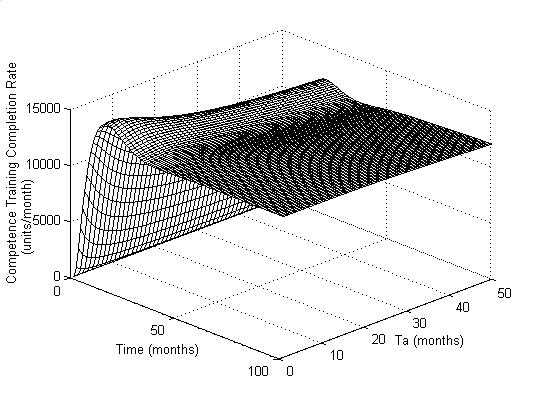
Figure 6c: Step response of COPM for varying values
of Ta
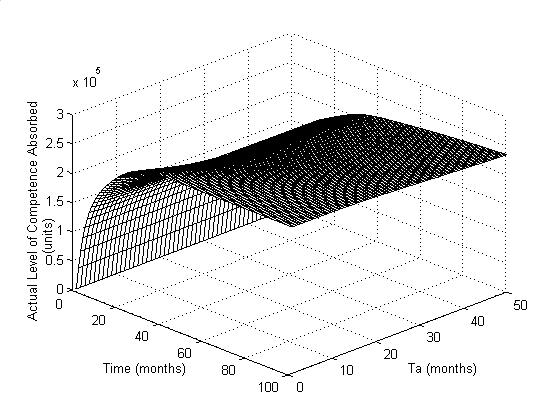
The Figure 6a shows that as
Ta is gradually increased, the overshoot becomes well managed but it
also shows that it takes a very long time (about 40 months) to settle, which is
unacceptable under any circumstances. Figure 6b illustrates that increasing Ta
decreases the peak value, thus the competence-training rate takes longer
time to settle, indicating that Ta has significant influence on the
system. Similarly, figure 6c shows that increasing Ta slightly
increases the time for rise.
The Figures 7a, 7b and 7c
illustrate the influence of Tdt.
Figure 7a. Step response of COPM for varying
values of Tdt
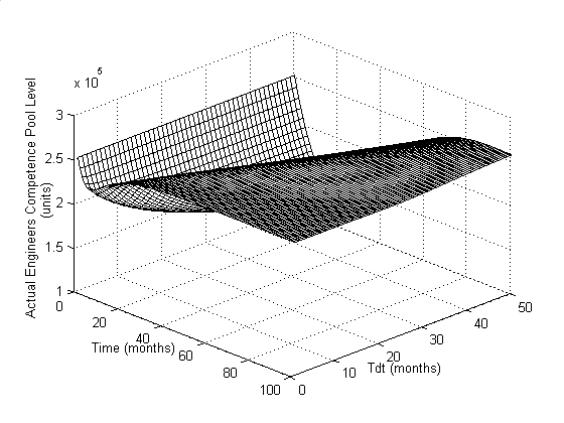
Figure 7b: Step response of
COPM for varying values of Tdt
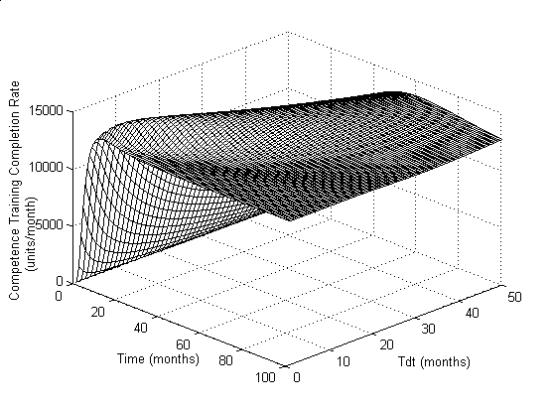
Figure 7c: Step response of
COPM for varying values of Tdt
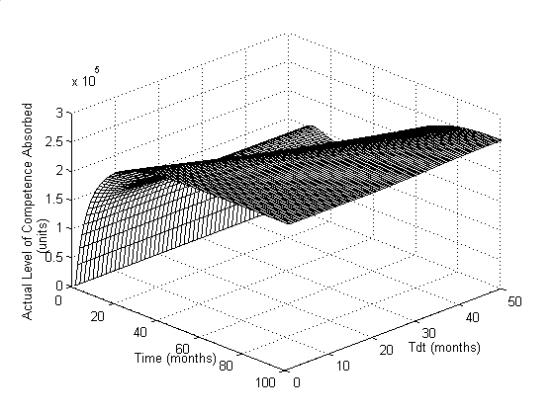
Smaller the Tdt values,
quicker will be the competence pool recovery (Figure 7a). For values of Tdt
upto 8 months, slight rise in Tdt will cause increase in
competence training completion rate (Figure 7b). Figure 7c shows that
increasing Tdt slightly increases the time for rise, thus taking 70
months to settle, which is also unacceptable.
Figure 8 shows the response
of Actual Level of Competence Absorbed for varying values of Tdr .
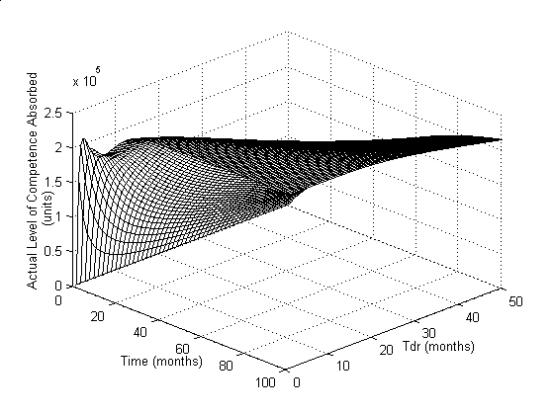
Figure 8: Step response of COPM for varying values of
Tdr
Smaller values of Tdr
may allow quicker settling of the competence absorption, but at the same time induces
unwanted oscillations, however, graph indicates that 3 – 6 months would be
ideal. The detailed explanation of performance index based on the policy
parameters is given in Table 1.
|
|
COPM
Design Parameters |
||||
|
Performance Index |
|
Tr |
Ta |
Tdt |
Tdr |
|
Actual Engineers Competence Pool Level |
Initial competence pool drop |
Increasing Tr
increases the initial competence pool drop |
Increasing Ta increases the initial competence pool drop |
Increasing Tdt increases the initial competence pool drop |
NA
|
|
Duration of competence pool deficit |
Increasing Tr increases the settling time |
Increasing Ta increases the settling time |
Increasing Tdt increases the settling time |
NA |
|
|
Peak competence pool overshoot |
Increasing Tr
decreases the peak Value |
Increasing Ta decreases the peak overshoot |
Increasing Tdt decreases the peak values |
NA |
|
|
Settling time |
80 months [Figure
5a] |
75 months [Figure 6a] |
73 months [Figure 7a] |
NA |
|
|
Graduation Completion Rate |
Rise time |
Increasing Tr
slightly increases the time
for rise |
Increasing Ta slightly increases the time for rise |
Increasing Tdt slightly increases the time for rise |
NA |
|
Peak Overshoot |
Increasing Tr
decreases the peak value |
Increasing Ta decreases the peak overshoot |
Increasing Tdt increases the peak value |
NA |
|
|
Duration of Overshoot |
Increasing Tr
slightly increases the time
for peak value |
Increasing Ta slightly increases the time for overshoot |
Increasing Tt slightly increases the time for peak value |
NA |
|
|
Settling time |
35 months [Figure
5b] |
55 months [Figure 6b] |
50 months [Figure 7b] |
NA |
|
|
Actual Level of Competence Absorbed |
Rise time |
Increasing Tr
slightly increases the time
for rise |
Increasing Ta slightly increases the time for rise |
Increasing Tdt increases the time for rise |
Increase in Tdr increases the time for rise |
|
Settling time |
60 months [Figure
5c] |
30 months [Figure 6c] |
70 months [Figure 7c] |
80 months [Figure 8] |
|
Table 1: Performance Index
for a range of policy parameters
6. Contribution
Of The Research
A large group
of researchers (Coyle, 1977; Towill, 1982; Cheema et al., 1989; Ferris &
Towill,1993; Mason et al., 1995; Hafeez et al., 1996) have very successfully
applied system dynamics in industrial system, customer service level,
production control system, supply chain management, and efficient consumer
response. This research work goes in similar lines and finds its use in
studying the KM & HRM dynamics in engineering education system. Engineering
is a very creative field, which encompasses the inculcation of a group of
abilities including analysis, synthesis, designing, evaluation,
experimentation, etc. Further, these skills are coupled with managerial and
leadership qualities during the course of study. Hence, the current trend is to
absorb engineers in IT industries irrespective of their branches. In fact,
engineering has now become one of the most sought after professions in Asian
countries, especially in India, where there has been a proliferation of
engineering education since the past two decades. So there is now a compelling
necessity to ensure that supply and demand balance with each other. In-built
checks and balances become very essential to fill the ‘competence gap’, which
by itself is dependent on several factors dealt in this study. Therefore this model
not only explains the system dynamics of engineering education system w.r.t. KM
& HRM but also explains in detail the effects of four basic policy
parameters viz. Ta, Tr, Tdt and Tdr.
7. Conclusions
And Scope For Future Work
Higher education in general
and engineering education in particular has a direct bearing on the economy of
a country (Wald, 2001), owing to the fact that it produces the technical human
resources who are responsible for the technological growth of the country.
Globalization has now made it imperative that there is a need to produce
engineers who are not only employable in the country but also meet the
international technical manpower requirements. So in this connection the KM
& HRM issues of engineering education become very important.
Our study is a direct
application of system dynamics into the KM & HRM issues of engineering
education. The results reveal that present and future competency gap can be
minimized through time effective competency training programmes. The COPM model
developed in this paper shows the effect of the policy parameters Ta,
Tr, Tdt and Tdr on the engineering
competence pool. The simulation also shows that the maximum time limit of 6
months to regain the competence loss could be very effective if the policy
parameters are controlled suitably.
Even though this model has
been developed for engineering education, its application may be extended to
other higher educational requirements. This study does not consider the effect
of feedback or feed-forward on the recruitment rate but focuses on the
development of engineering competence. So, the study may be further extended
based on the system dynamics of recruitment, considering all the influencing
factors such as socio-economical factors, influence of globalization,
technological growth rate etc.
8. References:
Baker, J., C., Mapels, J.,
New, C. C., 1997, A Hierarchical Model Of Business Competence, Integrated
Manufacturing Systems, Vol. 8; pp. 265-272.
Bhatt,
C., 2001, KM In Organizations: Examining The Interaction Between People,
Processes And Technology, Journal of KM, Vol. 5, No. 1; pp. 68-75.
Cheema, P., Towill, D., R.,
Bishop, B., 1989, A Combined Feed-Forward/Feedback ‘To-Make’ Model For A
Multi-Product Machine Shop, Proceedings of the 5th National
Conference on Production Research, Huudersfield: UK; pp. 101-105.
Coyle, R.G., 1977,
Management System Dynamics, John Wiley & Sons, London.
Ferris, J., S., Towill, D.,
R., 1993, Benchmarking A Generic Family Of Dynmic Manufacturing Ordering & Control
Models, Journal of Systems Engineering, Vol. 3; pp. 170-182.
Forrester, J. W., 1961,
Industrial Dynamics, Cambridge: MIT Press.
Hafeez, K., Abdelmeguid,
H., 2003, Dynamics Of Human Resources And Knowledge Management, Journal of the
Operation Research Society, Vol. 54; pp. 153-164.
Hafeez, K., Griffiths, M.,
Griffiths, J., Naim, M., M., 1996, System Design Of A Two-Echelon Steel
Industry Supply Chain, International Journal of Production Economics, Vol. 45;
pp. 121-130.
Mason-Jones, R., Towill,
D., R., Hafeez, K., 1995, Dynamics Of Pipeline Control, Proceedings of XIV
Operational Management Conference, Israel, 10-13 July.
Neef,
1999, Making The Case For Knowledge Management: The Bigger Picture, Management
Decisions, Vol. 37, No. 1; pp. 72-78.
Nonaka, I., Takeuchi, H.,
1995, The Knowledge Creating Company: How Japanese Companies Create Dynamic
Innovation, New York: Oxford University Press.
Raub,
S., Rulling, C. C., 2001, The Knowledge Management Tussle – Speech
Communication And Rhetorical Strategies In The Development Of KM, Journal of
Information Technology, Vol. 16, No. 2; pp. 113-130.
Routledge, 2000, Concise
Routledge Encyclopaedia of Philosophy, New York: Routledge.
Sheshagiri, M., 2004,
Gearing Up For The GATS, Education Times, Bangalore Edition, August, 16; pp. 11.
Senge, P., M., 1994, The
Fifth Discipline: The Art And Practice The Learning Organization, Doubleday:
New York.
Sushil, 1993, How To
Develop A System Dynamic Model?, System Dynamics, A Practical
Approach For Managerial Problems, ISBN: 81-224-0498-7, Wiley Eastern
Publication.
Towill D., R., 1982,
Dynamic Analysis Of An Inventory And Order Based Production Control System,
International Journal of Production Research, Vol. 20; pp. 671-687.
Tripathi, P., C., (Ed.),
2002, Acquisition Of Human Resources, Human Resource Development, Sultan Chand
& Sons, New Delhi.
Turban,
E., Aronson, J.,E., (Eds.), 2002, Knowledge Management, Decision Support Systems And Intelligent
Systems, Pearson Education, ISBN 81-7808-367-1.
Wald, M., 2001, Engineering
Education, Globalization & Learning Styles, International Journal of
Engineering Education, Vol. 17, No. 1, UK: Tempus Publication ISSN 0949-149X;
pp. 1.
Appendix 1
Nomenclature Used In This paper
- CPG = Competence Gap.
- COPM = Competence Pool Model
- DECPL = Desired Engineers
Competence Pool Level = 250000 units.
- AECPL = Actual Engineers
Competence Pool Level.
- CTRATE = Competence Training
Rate.
- FGCFR = Forecast Graduate
Competence Fail Rate.
- Tr = Time over which the
competence gap is to be recovered.
- Ta = Average time to
determine the forecast competence loss rate.
- PGCFR = Present Graduate
Competence Fail Rate.
- CTCRATE = Competence Training
Completion Rate.
- Tdt = Competence Training Delay Time.
- ALCA = Actual Level of
Competence Absorbed.
- Tdr = Recruitment
Delay Time.
Appendix 2
Equations Used In This Study
- CPG = DECPL -AECPL
- CTRATE = CPG * (1/ Tr )
+ FGCFR
- CTCRATE = CTRATE * (1/ (1 + Tdt * S))
- 4. AECPL = (1/S) * (CTCRATE
- PGCFR)
- FGCFR = PGCFR * (1/ (1 + Ta
* S))
- ALCA = AECPL * (1/ (1 + Tdr
* S))
- AECPL/PGCFR = (Tr) *
((Tdt+ Ta)*S + (Tdt*Ta*S2))
/ ((1 + Ta*S)(1 + Tr*S + Tr*Tdt*S2))
- CTRATE/ PGCFR = (1+ (Tr+
Ta)*S)/ ((1 + Ta*S)( 1 + Tr*S + Tr*Tdt*S2
))
About the Authors:
Mr.
Lewlyn L. R. Rodrigues is a Ph.D. scholar in Knowledge Management & Human
Resource Management at Manipal Academy of Higher Education, Manipal, India. He
is widely pub;ished and is the recipient of several best paper awards and
‘Award of Excellency’ from the Labour and Social Affairs, Bahrain.
Lewlyn L. R. Rodrigues
B.E(Mech.), M.Tech.(Prodn. Engg.) Ph.D. Scholar, Faculty, Dept. of Mechanical
& IP Eng., Manipal Institute of
Technology, Manipal 576104, Karnataka India; Email: rodrigusr@yahoo.com;
Telephone: +91-0820-2571061-70 Ext. 24042; Mobile: 091-9845218118; FAX: +91-0820-2571061-71
Mr.
Morvin Savio Martis, is a M.Tech. student at Manipal Institute of Technology
working on his thesis under the guidance of Mr. Rodrigues. He is B. E. in Mechanical
Engineering. His is currently working on his dissertation of M.Tech. in
Engineering Management on System Dynamics of HRD & KM.
Morvin
Savio Martis B.E.(Mech.), III Sem. M.Tech., Dept. of Mechanical & IP
Eng., Manipal Institute of Technology, Manipal 576104, Karnataka India; Email: oceanmartis@yahoo.com; Telephone:
+91-0820-2571061-70 Ext. 24042; Residence: 091-0824-2248078; FAX:
+91-0820-2571061-71