Use Of Simulation
Experiments To Evaluate Knowledge Management Modeling Quality
Anitha Srinivasan, Barry Horowitz, University of Virginia
ABSTRACT:
Real world problem solving can include complex dimensions, especially while tackling broad business problems or organizational challenges. To do justice to the complexity of issues involved, advanced modeling techniques need to be used. Use of complex modeling techniques bring along many issues associated with them. Chief among these issues are the effectiveness of the model and the modeler as well as an organization’s control over use of the model to solve the problem at hand. These issues affect an organization’s ability to learn the advanced modeling procedures and consistently and correctly apply them to develop implementable and highly effective solutions to problems and challenges. This paper suggests a structured framework to assess the quality of a knowledge management model and provides an illustration using a Partial Least Squares (PLS) Regression model used in a parallel research effort focused on knowledge management (Srinivasan and Horowitz, 2004). This paper also discusses the efficacy of hypotheses-based model construction, the trade-offs modelers need to make and the importance of the skills of the modelers, based on observations from a simulated experiment.
Introduction
Given that most modern day companies are struggling with hard to quantify problems like the ones described above, corporations must rely heavily on their modelers’ skills. Therefore it is vital to have a structured framework to assess modeling quality in order to place trust in a business modeler’s work as a basis for investing large sums of money. To address the need for model validation when addressing knowledge management problems, this paper proposes and demonstrates the use of simulation as a powerful tool for assessing the quality of an analytical knowledge management model. In particular, the paper demonstrates the use of simulation in assessing the quality of a model constructed using a technique called Root Causes Analysis (RCA) Modeling, generically known as Structural Equation Modeling (Barclay et. al., 1995). The RCA modeling technique refers specifically to the methodology applied to a broader set of business challenges solved as part of a larger research effort (Srinivasan and Horowitz, 2004), where root causes were hypothesized for creating potential management responses to key business challenges and the relationships between the root causes and the challenge being addressed were modeled using a structural equation model.
This paper draws upon the results of a controlled simulation experiment that was performed to evaluate an RCA model constructed in the larger research effort (Srinivasan and Horowitz, 2004). In particular, different types of sensitivity analyses were conducted to demonstrate the robustness of the model.
The first section of the paper provides a high level description of an RCA model and a brief explanation of the Partial Least Squares (PLS) Regression technique that is used to analyze the model. In the second section, the underlying RCA model that is evaluated using a simulation experiment is described briefly. This is followed by the model quality assessment methodology that involves four different sensitivity analyses that are described in turn in the subsequent sections. Next, a discussion on the efficacy of hypotheses-based model construction and the importance of the skills of the modelers is provided. Finally, the key conclusions from this paper are synthesized.
RCA Model And The PLS Technique
RCA models for knowledge management are used to identify the potential relationship between management actions and desired effects. RCA models are similar to conceptual models (Barclay et. al., 1995) that consist of:
§ Problem-specific hypotheses or CONSTRUCTS (also known as entities, that are items of direct interest but not directly measurable within the organization)
§ MEASURES that are manifestations of the hypothesis constructs (also known as attributes that can be more easily observed in the participating organization). These measures are related to the constructs either in a formative sense (measures define the construct) or in a reflective sense (construct defines the measures)
§ CAUSAL PATHS linking the constructs (also known as relationships or influence paths).
Figure 1 isa simple illustration of an RCA model that identifies two root causes for the “Employee Productivity” problem.
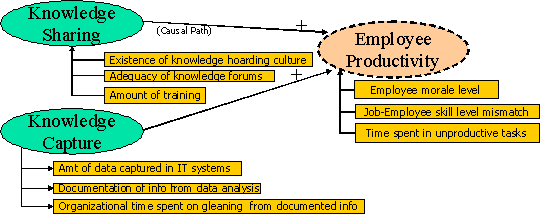
Figure 1 Simple RCA Model
In this illustration, we see critical root causes listed in oval blocks with the connecting arrowheads (causal paths) pointing in the direction of causality. The measures for these root causes are shown within rectangles, adjacent to each root cause.
PLS, a structural causal modeling technique is used to rank order, by importance, the root causes in an RCA model. The PLS methodology is used to build a linear model, Y= f(X) + Error Term, where, in this application, Y= Business Challenge; X = Root Causes. Further, each of the root causes are themselves linearly regressed with their measures, to arrive at strong measurement equations for the root causes. References (Barclay et. al., 1995), (Fornell and Larcker, 1981), (Hulland, 1999) and (Bontis and Fitz-enz, 2002) detail the analytics behind this statistical technique. The data that is collected in order to carry out an analysis is a set of employee responses to questions regarding root cause candidates. The data required to populate the RCA model was captured using a survey that contains Likert-type scale questions (1-Strongly disagree to 4- Strongly agree).
RCA Model Used For Simulation Experiment
As a first step, a base RCA model was identified for use in the simulation study. This RCA model was created for a large technology professional service organization whose management team defined a key business challenge of increasing the amount of innovation provided in the development of technical solutions provided to clients. Figure 2 illustrates the RCA model that is being used in this study. As shown in the model, there were 12 constructs (Srinivasan & Horowitz, 2004) used to explain the variance in the final dependent construct, “Innovation Throughput”, which will be referred to as MAIN from now on.
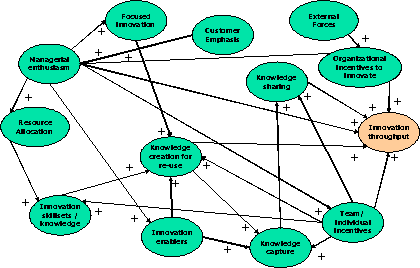
Figure 2 RCA Model
Model Quality Assessment Methods
Three research questions arise in the context of assessing the quality of our RCA model. They are as follows:
1. How does a management team know that the model is good?
2. How will modeling quality vary with different model formulations?
3. How will modeling quality vary with different levels of response quality?
The answer to the first question is derived by looking at the final R2 (the value of co-efficient of determination that reflects the ‘goodness of fit’, or the explanatory power of the RCA model) value of the dependent construct. The higher the value of R2, which means most of the significant explanatory variables have been accounted for in the model, the better the model. Hence, R2 alone (which is a PLS output) is a reasonable metric for assessing model quality and no further analysis is necessary.
The answer to the third question is very difficult to assess, without conducting controlled experiments multiple times, with actual responders. This experiment would require responders to take multiple surveys (ranging from very accurate to totally random responses). Further analysis was not conducted, given the difficulty in making the respondents (who are employees of a corporate organization, in our case) answer multiple surveys, over a period of time.
Finally, moving on to the second research question, answers are derived by studying variations in R2. Specifically, the following sensitivity analyses were performed:
§ Sensitivity of overall R2 to the exclusion of specific constructs that take away from structural model completeness
§ Sensitivity of overall R2 to the exclusion of specific measures / questions that take away from the completeness of the measurement model
§ Sensitivity of R2 to the structural model formulation as a method for measuring the efficacy of the structural model
§ Sensitivity of R2 to the measurement model specification in order to measure the efficacy of the specification
Sensitivity
Of Overall R2 To The Exclusion Of Constructs
In this sensitivity analysis, the variation of R2 to the number of constructs in the model was studied. Apriori, for each construct an assumption was made on the % of respondents who agree that the given construct directly influences MAIN. Table 1 summarizes these apriori assumptions and the abbreviations that will be used henceforth for all the constructs, along with whether their measures are reflective or formative. Among those who agree, a percentage was established for respondents who Strongly Agree (SA) was also decided. The SA percentages are given in brackets. The establishment of the various percentages served as a case study for determining the relative importance of root causes.
|
Name of Construct |
Abbreviation |
% who agree (% who SA) |
|
1. Customer emphasis (Reflective) |
CEMP |
20% (10% SA) |
|
2. Managerial enthusiasm and participation (Reflective) |
MEMP |
55% (30% SA) |
|
3. Innovation skillsets (Formative) |
ISK |
40% (20% SA) |
|
4. Innovation enablers (Formative) |
IEN |
45% (25% SA) |
|
5. Focused innovation (Formative) |
IFO |
85% (45% SA) |
|
6. Knowledge creation for reuse (Formative) |
KCR |
90% (45% SA) |
|
7. Knowledge capture (Formative) |
KCAP |
65% (35% SA) |
|
8. Knowledge sharing (Formative) |
KSH |
80% (40% SA) |
|
9. Resource Allocation (Formative) |
RALL |
30% (15% SA) |
|
10. Team/ individual incentives (Reflective) |
TEAM |
70% (35% SA) |
|
11. Organizational incentives (Reflective) |
ORG |
10% (4% SA) |
|
12. External Forces (Reflective) |
EXT |
5% (2% SA) |
|
13. Innovation Throughput, the final dependent construct (Reflective) |
MAIN |
75% (40% SA) |
Table 1 Our a priori assumptions
for ABC Company
The input data set for running the Latent Variable Partial Least Squares (VPLS) software according to these assumptions was created to feed the software. The overall R2 value for MAIN was found out to be 0.85. Table 2 shows the R2 values for all the constructs.
|
R2
Values |
MAIN |
CEMP |
MEMP |
ISK |
IEN |
IFO |
KCR |
KCAP |
KSH |
RALL |
EXT |
ORG |
TEAM |
|
MAIN |
0 |
0 |
0.02 |
0 |
0 |
0 |
0.01 |
0 |
0.41 |
0 |
0 |
0.00 |
0.41 |
|
CEMP |
0 |
0 |
0 |
0 |
0 |
0 |
0 |
0 |
0 |
0 |
0 |
0 |
0 |
|
MEMP |
0 |
0.11 |
0 |
0 |
0 |
0 |
0 |
0 |
0 |
0 |
0 |
0.05 |
0 |
|
ISK |
0 |
0 |
0 |
0 |
0 |
0 |
0 |
0 |
0 |
0.59 |
0 |
0 |
0.11 |
|
IEN |
0 |
0 |
0.60 |
0 |
0 |
0 |
0 |
0 |
0 |
0 |
0 |
0 |
0 |
|
IFO |
0 |
0 |
0.23 |
0 |
0 |
0 |
0 |
0 |
0 |
0 |
0 |
0 |
0 |
|
KCR |
0 |
0 |
0 |
0.10 |
0.08 |
0.40 |
0 |
0 |
0 |
0 |
0 |
0 |
0.09 |
|
KCAP |
0 |
0 |
0 |
0 |
0.16 |
0 |
0.01 |
0 |
0 |
0 |
0 |
0 |
0.55 |
|
KSH |
0 |
0 |
0 |
0 |
0 |
0 |
0 |
0.10 |
0 |
0 |
0 |
0 |
0.41 |
|
RALL |
0 |
0 |
0.32 |
0 |
0 |
0 |
0 |
0 |
0 |
0 |
0 |
0 |
0 |
|
EXT |
0 |
0 |
0 |
0 |
0 |
0 |
0 |
0 |
0 |
0 |
0 |
0 |
0 |
|
ORG |
0 |
0 |
0 |
0 |
0 |
0 |
0 |
0 |
0 |
0 |
0.43 |
0 |
0 |
|
TEAM |
0 |
0 |
0.48 |
0 |
0 |
0 |
0 |
0 |
0 |
0 |
0 |
0 |
0 |
Table 2 R2 contributions of all constructs
Using these R2 contributions, the direct and indirect (hence total) effects of each construct on MAIN was computed. Figure 3 illustrates how to compute the direct and indirect effects of a construct. The percentages shown are the R2 contributions.
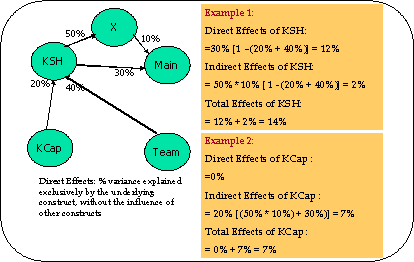
Figure 3 A
simple Illustration of Direct and Indirect Effects Computation
Using the method illustrated above, the total effects of every construct, was computed which is shown as a pie chart in Figure 4.
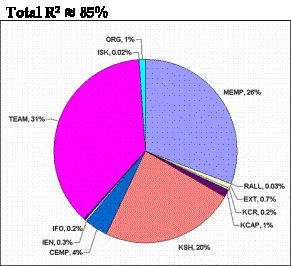
Figure 4 Total effects distribution
It is clear from Figure 4 that the major contributions to R2 come from three constructs: TEAM, MEMP, and KSH. The remaining contributions are only minor. Not including even one of these major constructs would reduce the value of R2 drastically as is observed in Figure 5, where the R2 values for MAIN are derived by adding 1 construct to another in two different sequences (until all 12 constructs were reached):
1. Minimum Total effect constructs first until all constructs are accounted for
2. Maximum Total effect constructs first until all constructs are accounted for
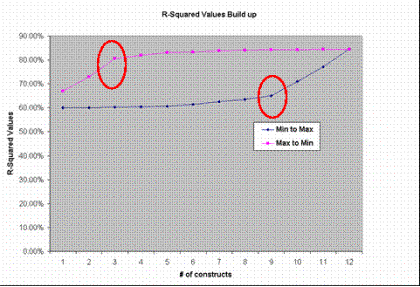
Figure 5 Variation of R2 values to # of constructs
For a given number of constructs, the minimum and maximum R2 values obtainable can be read from the graph. The graph also shows that steep increases in R2 are seen only when the most significant constructs are added. Therefore if the most significant constructs in the model are included, one can get a very high R2 (81%), using only three constructs in the model. On the other hand, if the three most significant constructs are not included, one will end up with only 65% R2 despite using as many as 9 constructs. However, since the most significant constructs cannot be identified a priori, one would benefit only with more constructs included in the model, which gives a better chance of including the most significant ones. Thus, our theoretical approach of including 12 conceptually hypothesized constructs in the model gave us a better chance of including the most significant ones.
Sensitivity Of Overall R2 To The
Exclusion Of Measures/ Questions
In this analysis, the variation of R2 to the exclusion of both measures and questions were studied. The most important measures were sequentially removed from constructs in the descending order of construct significance. For measures with more than one question, the variation of R2 with reduction in number of questions was studied (Questions were taken out from the most significant measures only.) By conducting this analysis, the efficacy of the measurement model can be studied and one can get a sense of the trade-off between asking too many questions and potentially reducing respondents due to the size of the questionnaire. Figure 6 shows the number of measures associated with every construct and the corresponding number of questions, for each measure.
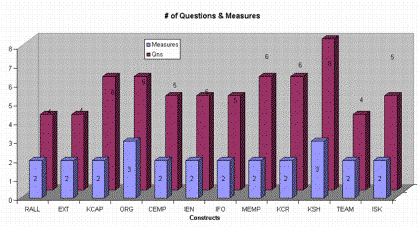
Figure 6 Chart showing number of measures and questions for each construct
Every construct had a minimum of two measures and a maximum of upto three measures. The number of questions associated with every measure ranged from two to three, thereby making a total of four to six questions per construct.
The most important measures for each construct were identified, using the measurement model weights obtained from one of the LVPLS software outputs. Figure 7 depicts these measurement model weights, which helps identify the most important measures for each construct.
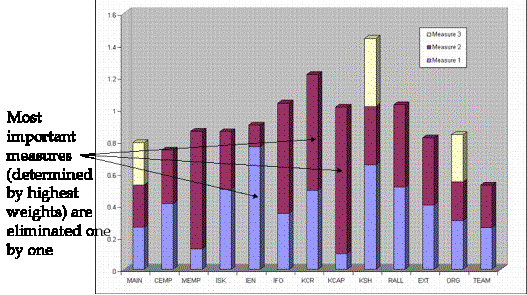
Figure 7 Chart showing measurement model weights
Based on the data from Figure 7, measures could be eliminated one by one from the constructs in two different sequences: most significant to the least significant and vice-versa. Figure 8 plots the variation of R2 vs number of questions asked, for both of these sequences.
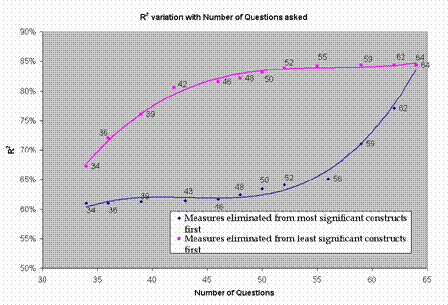

Figure 8
Variations of R2 value with number of questions
One may ask as few as 34 questions or as many as 56 questions and achieve an R2 between 60% & 64% (Using a sequence based on first removing the most important measures from the most significant constructs). However if one asks the ‘right’ questions (corresponding to the most important measures in the significant constructs), one can jump from 64% to 84% R2 (Using a sequence based on first removing the most important measures in the most significant constructs) or even get 80% R2 with as little as 42 questions (Using a sequence based on first removing the most important measures in the least significant constructs). However, since it is not possible to identify the most significant construct or the most important measure apriori, one would benefit only with ‘logical’ constructs and measures (questions) included in the model which provide a better chance of including the most significant/important ones. Hence, an ‘intuitive’ approach to defining the measures, agreed to by the organization for whom the analysis is being conducted, was adopted. This approach is relied upon to provide us with a substantial liklihood of including the most important ones.
In connection with the study of variation of R2 with reduction in number of questions, a discussion is provided on why only two to three questions were used to capture a measure and why each construct had only two to three measures. The essence of most measures was captured using one question to bring to bear each of the social and knowledge characters[1], making a total of two questions for these measures. In some cases, measures were independent of the characters, but required other unique traits to be brought out through their own customized questions. With three such questions, the essence of these measures could be captured. Going beyond three questions might have led to a marginal increase in R2, but would have led to a number of questions that might reduce the survey response rate (and hence impacting statistical validity). On the other hand, a minimum of two questions per measure were used to maximize R2, as demonstrated in figure 9.
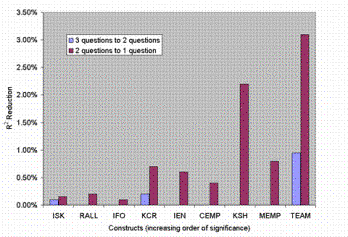
Figure 9 Chart showing R2 reduction due to elimination of
questions
One question from the most important measure in each construct was eliminated, until there was only one question left in that measure. (If there is only one question left in the measure, it was left intact). Figure 9 shows the plot of the R2 changes due to removing a question as we moved from three questions for the most important measure to two questions, and further from two questions to one question. We see that moving from two questions to one decreases R2 more than moving from three questions to two. Hence, a minimum of two questions was utilized to maximize R2 while operating within our self-imposed constraint of having only two to three questions per measure.
Next, the rationale for having only two to three measures per construct is as follows. Most of the constructs in our RCA model could be adequately measured in the organization using characteristics like effectiveness/ efficiency/ existence/ adequacy of the underlying construct, or through measures that are equivalent or related to these characteristics. While two of the above characteristics were adequate measures for most constructs, in the case of some constructs, more than two of the above characteristics were applicable and hence these constructs required three measures. This reasoning was combined with the overarching objective of keeping the number of survey questions to a minimum, in order to achieve a satisfactory response rate, resulting in an upper limit of three question per construct.
The results presented above served to demonstrate that each measure needed at least two questions to achieve high R2 values. If on an average, each construct had two measures and each measure had two to three (avg. = 2.5) questions, then for our twelve (plus one final dependent) construct RCA model formulation, we end up with 13 * 2 * 2.5= 65 questions in order to achieve the desired R2 results.
Sensitivity Of Overall R2 To The
Efficacy Of Structural Model Formulation
Here, the variation of R2 to different formulations of the structural model (path relationship definitions) was studied. This was done by comparing the R2 of our RCA model (one that uses PLS technique) with the R2 of an Ordinary Least Squares (OLS) regression model. While PLS is the best specified model in terms of path relationships, the OLS has a simpler, but less accurate specification. Figure 10 shows a pictorial representation of models that use the “PLS and the”OLS” techniques.
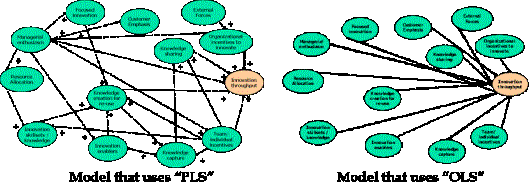
Figure 10 Pictorial comparison of PLS and OLS models
Note that the lower bound for R2 using partial least square regression models can be determined from the OLS model. The importance structural model formulation being as complete as possible has already been established above, by proving that the difference between the lower and upper bounds for R2 was significant. First, from the previous section, it is noted that the R2 value using the PLS technique was found out to be 85%. As a next step, instead of specifying any path relationships, all the independent constructs to the final dependent construct were directly connected (i.e., no multi-factor paths were used in the analysis) and the LVPLS software was re-run, in accordance with the “OLS” model of Figure 10, to generate the value of R2 for the OLS case. This was found out to be only 68%, as shown in Figure 11.
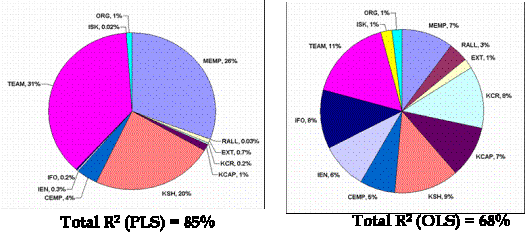
Figure 11
Pie-chart comparison of PLS and OLS R2 values
Sensitivity Of Overall R2 To The
Efficacy Of Measurement Model Specification
In this sensitivity analysis, the variations of R2 to the specification of the measurement model were studied. By measurement model specification, we mean the definition of measures as being reflective or formative in their relationship to their respective constructs. In this analysis, we varied the definitions between reflective and formative to study the effect on R2. If measure specification does not make a big difference to R2, then the ‘measurement model’ part of the PLS technique becomes less relevant to solving the problem at hand. On the other hand, if measure specification does make a significant difference in R2, then it is important to logically think through each measure definition and correctly specify whether they are reflective or formative.
We first illustrate how difficult it can be to classify measures as formative or reflective, in order to illuminate the importance of this sensitivity analysis. In our RCA model, for the construct “Innovation Focus”, we have the following measures: “Ability of organization to have continuity of focus that enables effective innovation to take place” and “Effectiveness of future agenda setting.”
These measures might be modeled as being reflective, in the sense that an organization’s innovation focus drives its ability to have continuity of focus as well as its effectiveness in setting an innovation agenda for the future. However, they might also be modeled as being formative in the sense that the innovation focus must first come into being and then sustained over time, which is enabled by the organization’s ability to have continuity of focus as well as its effectiveness in setting an innovation agenda for the future.
Having established the possibility for different treatments in defining measures, we shall now show how critical it is to get the formative and reflective nature of the measures correct. We showed earlier in Table 1 how we defined the measures for each construct, as being either reflective or formative. These definitions were completely swapped (i.e. changed “Reflective” to “Formative” and vice-versa), the LVPLS software re-run and the new R2 value was observed. Apart from the swapped measure definitions sets, nine randomly specified definition sets were used, and their corresponding R2 values were observed from the PLS outputs.
Figure 12 shows the R2 values for the models with these different specifications. We see that in most cases R2 values of “zero” were obtained due to erroneous classifications. Even in the cases where R2 values were obtained, they were less than the 85% R2 obtained by specifications based upon using conceptually hypothesized logic.
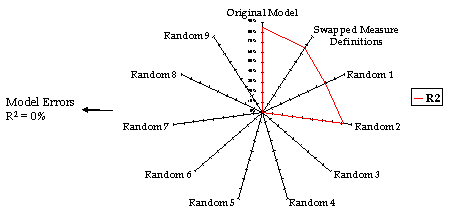
Figure 12
Variations in R2 values by changing measure definitions
Thus, the importance of defining the measures in the measurement model correctly based on conceptually sound logic has been demonstrated. As can be seen through the various model quality simulation experiments discussed thus far, we have made a significant effort to adopt sound modeling techniques in constructing our RCA model, namely:
§ Exhaustively defined conceptually-hypothesized constructs
§ Most intuitive and exhaustive measures/ questions for each construct
§ Path relationships formulated using conceptually sound apriori hypotheses
§ Logically sound Formative/Reflective specifications for all the measures
We now proceed to discuss the trade-off involved in these kinds of models, and thereby establish the importance and dependence on the modelers.
Trade-Off Discussion: Importance And
Dependence On Modelers
One of the key results from these (simulated) modeling quality experiments is the fact that there are many trade-offs that need to be made, in order to achieve good results. Figure 13 provides an overall picture of the trade-off dimensions.
Figure 13 Summary of Trade-off Dimensions
More specifically, there are the following three trade-offs that are worth our attention:
1. Number of constructs vs auto correlation vs capturing the most powerful causal factors: This trade-off needs to be made to determine the optimal number of constructs. A large number of constructs increases the chances of having included the most significant causal factors in the model, thereby improving the R2. However, it can also result in ‘causality dilution’, where by correlation among constructs (auto correlation) prevents identification of two to three critical factors that can be addressed as genuine ‘root causes’ to solve the problem to a large extent. On the other hand, having a small number of factors might avoid the autocorrelation problem, but limits the effectiveness of the modeling exercise (Low R2) while increasing the chances of leaving out the key constructs, that cannot be known apriori. Making this trade-off requires judgement based on the organizational problem being addressed. In order to soundly make the necessary judgments, the knowledge management modeler must establish a close working relationship with the organization requiring a solution and, together hypothesize the most important constructs for inclusion in the model.
2. Complexity vs Simplicity/ease of understanding in the definition of the structural model relationships: Being very accurate in defining causal relationships requires empirical knowledge from reviewing relevant literature, as well as business judgement specific to the organizational problem being addressed. Over and above using business knowledge in defining these relationships, modelers need to determine whether including a causal relationship adds value to the model in the context of the problem. This determination can make the difference between an extremely complex model with an intricately woven web of causal relationships that are very difficult to communicate to a business audience and a too simply defined model that is ineffective in identifying ‘authentic’ causal constructs.
3. Number of measures vs Number of questions in each measure vs Survey response rates and Quality of responses: This trade-off needs to be made to determine the optimal number of measures, which in turn determines the number of questions used to collect data on the measures. For accurately populating a measure with data, it has been shown that for the models discussed in this paper, one would need at least two questions per measure. More questions per measure would mean better estimation of the measure, which in turn means a better model result. On the other hand, if there are too many questions, then the number of people responding to the surveys (to collect data and populate the models) could diminish. In the interests of statistical rigor[2] while populating the model, it is better if a large number of people respond to the surveys. Overall, if a large number of measures are defined, there is a greater chance of including the most important measures, while, at the same time, one stands the risk of including too many questions and reducing the survey response. If one decides to restrict the number of questions to preserve response rates, one would not get adequate input data for each measure, thereby making the model less effective. A modeler can make this trade-off by exhaustively identifying a set of measures and questions and then pruning it down by applying a filter of what is most important to the organization under study. Pruning is done, down to a number of questions that is expected to elicit the minimum number of responses required to get statistical validity on the results. A modeler needs to not only have the business knowledge to exhaustively identify measures and questions in the first place but also make the judgement calls on what measures and questions are the most important to the context of the problem at hand.
Having shown that the trade-offs discussed above can significantly influence the outcome of a modeling exercise, it should be highlighted that an RCA model is only as good as the modeler.
Conclusion
Models for dealing with knowledge management trade-offs are complex, involving a variety of factors that do not readily lend themselves to quantitative analysis. The RCA model discussed in this paper is a suggested approach for addressing knowledge management. However, one must be very cautious in managing the quality of the RCA models that are to be used. Modeling quality can be assessed through a variety of means. All of these methods seek to address three major dimensions of modeling quality: 1) the capability to make an absolute measurement of the efficacy of the model, 2) the ability to calibrate the robustness of the model formulation itself, and 3) the ability to understand the robustness of the model to withstand variations in response quality. Irrespective of the modeling methodology used, goodness-of-fit measures like R2 provide absolute measurement of the model efficacy. Depending on the problem area, researchers can generalize R2 thresholds above which a model can be deemed to be of high efficacy. Studying the effect of response quality variations on modeling would require a number of experiments that were beyond the scope of this study. This paper focuses on assessing the robustness of model formulation and provides interesting insights and conclusions.
We have demonstrated a methodology to assess the robustness of the model formulation using different types of sensitivity analyses. Studying the sensitivity of R2 (measure of explanatory power of our PLS model) to the inclusion/exclusion of key explanatory variables, we established the importance of including the most significant variables in the model, to get superior R2. An effective way of including the most significant variables, is to adopt a logical, ‘intuitive, hypothesis based construct definition approach that exhaustively identifies the ‘root causes’ for the given problem.
Studying the sensitivity of R2 to the inclusion/exclusion of measures (for measuring the qualitatively defined explanatory variables) and questions to capture these measures, we showed how a reliable number of measures and questions could be obtained, managing the trade-off between data collection efficacy versus model effectiveness.
Further, we demonstrated how the effectiveness of a model is highly sensitive to the specification of the relationship between explanatory variables and their measures. It is vitally important that these measurement specifications are logically determined in order to obtain valid model results.
In illustrating the structured approach to assess modeling quality proposed in this paper, we also brought out the various trade-offs that modelers need to make while leveraging the power of advanced modeling techniques. Not only do these trade-offs have a significant bearing on model quality; if not made properly, they can also sour an organization’s experience with advanced problem solving approaches, thereby making them lose sight of the utility of such approaches in the long term. Therefore it is vital that modelers recognize the importance of these trade-offs and adopt a deliberate approach while making these trade-offs, clearly communicating the choices available to the organization and making them understand the outcomes emerging from the trade-off. It is equally vital for organizations to recognize the trade-offs and understand/appreciate the modeler’s skillsets that determine the quality of the model and problem solving efforts.
References
Bontis N., Fitz-enz J., 2002, Intellectual Capital ROI: A Causal Map Of Human Capital Antecedents And Consequents, Journal of Intellectual Capital, Vol. 3, Issue 3
Bridges W., 1993, The Character Of Organizations: Using Jungian Type In Organizational Development, Blue Ridge Summit, Pennsylvania, USA, 1st Edn.
Fornell C., Larcker D.F., 1981, Evaluating Structural Equation ModelsWith Unobservable Variables And Measurement Error, Journal of Marketing Research, Vol. 18
Goffee R., Jones G., 1998, The Character Of A Corporation: How Your Company’s Culture Can Make Or Break Your Business, Harper Collins, London, UK, 1st Edn.
MacCoby M, 2002, Toward A Science Of Social Character, International Forum of Psychoanalysis, Vol. 11 Issue1
Srinivasan A., Horowitz B.M., 2004, Developing Integrated Knowledge Management Solutions Based On The Unique Social And Knowledge Character Of Organizations, http://www.tlainc.com/jkmpv5.htm
About the Authors:
Anitha Srinivasan graduated with a
Masters in Systems Engineering from University of Virginia, Charlottesville.
She also holds a M.S. in Electrical Engineering from University of California,
Riverside. She is currently working as a Risk Management Analyst with
Constellation Energy, Baltimore, USA. Her research interests include Knowledge
Management, Intellectual Capital and Risk Analysis & Management.
Anitha Srinivasan, Garaduate
Research Assistant, Dept. of Systems Engineering, P.O. Box 400747, 151
Engineer's Way, Charlottesville, VA 22904. E-Mail: anu_vasan@hotmail.com, Phone: (410) 505
4378.
Dr. Barry Horowitz founded and
served as Chairman and CEO of Concept 5 Technologies, and served as President
and CEO of MITRE Corporation. His research interests include Knowledge
Management, Integration of Distributed Computing Systems, Rapid Application
Prototyping and Computer Security Assessments.
Dr. Barry Horowitz, Professor, Dept. of Systems Engineering, P.O. Box 400747, 151 Engineer's Way, Charlottesville, VA 22904. E-Mail: bh8e@virginia.edu, Phone: (434) 924 0306. Website URL: http://www.sys.virginia.edu/people/bh.asp
.